| Param | Original file | Final file |
|---|---|---|
| Filename | modeM0/AS1A07_062T01_9000003392cztM0_level2_bc.evt | modeM0/AS1A07_062T01_9000003392cztM0_level2_quad_clean.evt |
| Size (bytes) | 1,959,056,640 | 755,524,800 |
| Size | 1.8 GB | 720.5 MB |
| Events in quadrant A | 12,673,624 | 4,852,775 |
| Events in quadrant B | 12,733,357 | 4,898,262 |
| Events in quadrant C | 12,569,326 | 4,623,869 |
| Events in quadrant D | 17,394,870 | 4,527,306 |
| Mode M9 | |||
|---|---|---|---|
| Quadrant | BADHDUFLAG | Total packets | Discarded packets |
| A | 0 | 112 | 0 |
| B | 0 | 112 | 0 |
| C | 0 | 112 | 0 |
| D | 0 | 112 | 0 |
| Mode SS | |||
|---|---|---|---|
| Quadrant | BADHDUFLAG | Total packets | Discarded packets |
| A | 0 | 1184 | 0 |
| B | 0 | 1184 | 0 |
| C | 0 | 1184 | 0 |
| D | 0 | 1184 | 0 |
| Mode M0 | |||
|---|---|---|---|
| Quadrant | BADHDUFLAG | Total packets | Discarded packets |
| A | 0 | 120705 | 0 |
| B | 0 | 121157 | 0 |
| C | 0 | 122199 | 0 |
| D | 0 | 137126 | 0 |
| Quadrant | Total seconds | Saturated seconds | Saturation percentage |
|---|---|---|---|
| A | 58052 | 435 | 0.749328% |
| B | 58052 | 558 | 0.961207% |
| C | 58052 | 980 | 1.688142% |
| D | 58052 | 1143 | 1.968924% |
Noise dominated data is calculated using 1-second bins in cleaned event files. If a bin has >2000 counts, and if more than 50% of those come from <1% of pixels, then it is considered to be noise-dominated and hence unusable.
| Quadrant | # 1 sec bins | Bins with >0 counts | Bins with >2000 counts | High rate bins dominated by noise | Noise dominated (total time) | Noise dominated (detector-on time) | Marked lightcurve |
|---|---|---|---|---|---|---|---|
| A | 69232 | 58052 | 9 | 9 | 0.01% | 0.02% | 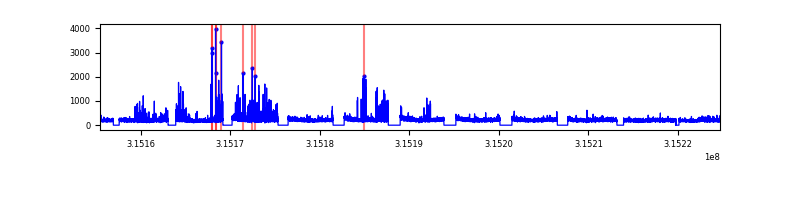 |
| B | 69232 | 58052 | 6 | 6 | 0.01% | 0.01% |  |
| C | 69232 | 58052 | 6 | 6 | 0.01% | 0.01% |  |
| D | 69232 | 58049 | 157 | 157 | 0.23% | 0.27% |  |
Top three noisy pixels from each quadrant. If the there are fewer than three noisy pixels in the level2.evt file, extra rows are filled as -1
| Pixel properties | Quadrant properties | ||||||
|---|---|---|---|---|---|---|---|
| Quadrant | DetID | PixID | Counts | Sigma | Mean | Median | Sigma |
| A | 6 | 16 | 410736 | 605.43 | 3125 | 3071 | 673.4 |
| A | 13 | 170 | 193428 | 282.7 | 3125 | 3071 | 673.4 |
| A | 13 | 254 | 92446 | 132.73 | 3125 | 3071 | 673.4 |
| B | 0 | 189 | 169646 | 280.89 | 3158 | 3089 | 593.0 |
| B | 0 | 190 | 138625 | 228.58 | 3158 | 3089 | 593.0 |
| B | 3 | 209 | 136113 | 224.34 | 3158 | 3089 | 593.0 |
| C | 0 | 10 | 701267 | 991.55 | 2995 | 2986 | 704.2 |
| C | 0 | 239 | 190361 | 266.07 | 2995 | 2986 | 704.2 |
| C | 7 | 247 | 112802 | 155.94 | 2995 | 2986 | 704.2 |
| D | 1 | 52 | 2496912 | 3489.26 | 3061 | 2958 | 714.8 |
| D | 13 | 153 | 849036 | 1183.74 | 3061 | 2958 | 714.8 |
| D | 13 | 172 | 531671 | 739.72 | 3061 | 2958 | 714.8 |
Histogram calculated using DETX and DETY for each event in the final _common_clean file
| Quadrant A | 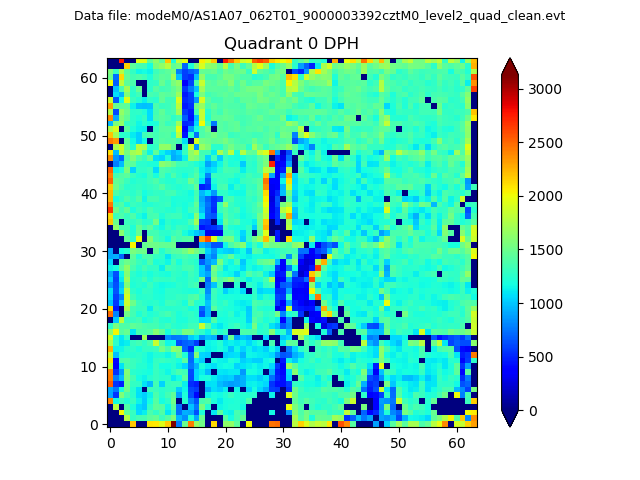 |
 |
Quadrant B |
|---|---|---|---|
| Quadrant D |  |
 |
Quadrant C |
| Plot type | Count rate plots | Images |
|---|---|---|
| Comparison with Poisson distribution Blue bars denote a histogram of data divided into 1 sec bins. Red curve is a Poisson curve with rate = median count rate of data. |
 |
 |
| Quadrant-wise count rates Data is divided into 100 sec bins |
 |
|
| Module-wise count rates for Quadrant A Data is divided into 100 sec bins |
 |
 |
| Module-wise count rates for Quadrant B Data is divided into 100 sec bins |
 |
 |
| Module-wise count rates for Quadrant C Data is divided into 100 sec bins |
 |
 |
| Module-wise count rates for Quadrant D Data is divided into 100 sec bins |
 |
 |
| Parameter | Plot |
|---|---|
| CZT HV Monitor |  |
| D_VDD |  |
| Temperature 1 |  |
| Veto HV Monitor |  |
| Veto LLD |  |
| Alpha Counter | 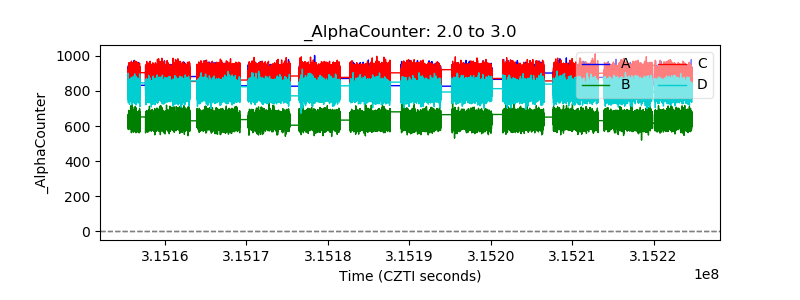 |
| _CPM_Rate |  |
| CZT Counter |  |
| +2.5 Volts monitor | 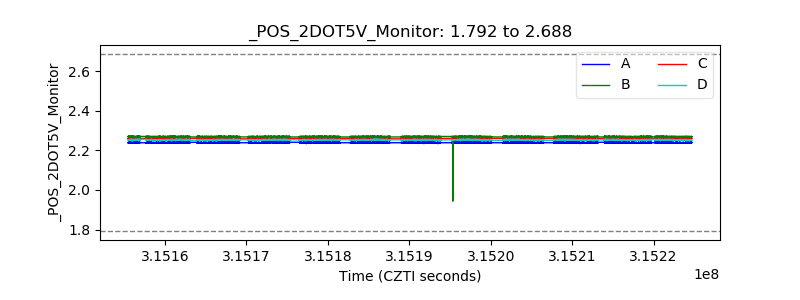 |
| +5 Volts monitor |  |
| _ROLL_ROT |  |
| _Roll_DEC |  |
| _Roll_RA |  |
| Veto Counter |  |