| Param | Original file | Final file |
|---|---|---|
| Filename | modeM0/AS1A08_009T01_9000003390cztM0_level2_bc.evt | modeM0/AS1A08_009T01_9000003390cztM0_level2_quad_clean.evt |
| Size (bytes) | 5,475,836,160 | 2,052,921,600 |
| Size | 5.1 GB | 1.9 GB |
| Events in quadrant A | 29,240,129 | 13,451,486 |
| Events in quadrant B | 30,378,119 | 13,726,120 |
| Events in quadrant C | 29,556,024 | 13,110,155 |
| Events in quadrant D | 67,136,268 | 12,308,460 |
| Mode M9 | |||
|---|---|---|---|
| Quadrant | BADHDUFLAG | Total packets | Discarded packets |
| A | 0 | 228 | 0 |
| B | 0 | 228 | 0 |
| C | 0 | 228 | 0 |
| D | 0 | 228 | 0 |
| Mode SS | |||
|---|---|---|---|
| Quadrant | BADHDUFLAG | Total packets | Discarded packets |
| A | 0 | 2850 | 0 |
| B | 0 | 2850 | 0 |
| C | 0 | 2850 | 0 |
| D | 0 | 2850 | 0 |
| Mode M0 | |||
|---|---|---|---|
| Quadrant | BADHDUFLAG | Total packets | Discarded packets |
| A | 0 | 288289 | 0 |
| B | 0 | 292530 | 0 |
| C | 0 | 294139 | 0 |
| D | 0 | 424359 | 0 |
| Quadrant | Total seconds | Saturated seconds | Saturation percentage |
|---|---|---|---|
| A | 139932 | 1218 | 0.870423% |
| B | 139931 | 1568 | 1.120552% |
| C | 139931 | 2166 | 1.547906% |
| D | 139931 | 12393 | 8.856508% |
Noise dominated data is calculated using 1-second bins in cleaned event files. If a bin has >2000 counts, and if more than 50% of those come from <1% of pixels, then it is considered to be noise-dominated and hence unusable.
| Quadrant | # 1 sec bins | Bins with >0 counts | Bins with >2000 counts | High rate bins dominated by noise | Noise dominated (total time) | Noise dominated (detector-on time) | Marked lightcurve |
|---|---|---|---|---|---|---|---|
| A | 167671 | 139936 | 8 | 8 | 0.00% | 0.01% |  |
| B | 167671 | 139934 | 60 | 60 | 0.04% | 0.04% |  |
| C | 167671 | 139934 | 22 | 22 | 0.01% | 0.02% |  |
| D | 167671 | 139922 | 3081 | 3081 | 1.84% | 2.20% |  |
Top three noisy pixels from each quadrant. If the there are fewer than three noisy pixels in the level2.evt file, extra rows are filled as -1
| Pixel properties | Quadrant properties | ||||||
|---|---|---|---|---|---|---|---|
| Quadrant | DetID | PixID | Counts | Sigma | Mean | Median | Sigma |
| A | 13 | 170 | 483977 | 293.53 | 7372 | 7244 | 1624.2 |
| A | 14 | 238 | 287627 | 172.63 | 7372 | 7244 | 1624.2 |
| A | 13 | 254 | 220159 | 131.09 | 7372 | 7244 | 1624.2 |
| B | 0 | 190 | 560989 | 396.03 | 7434 | 7257 | 1398.2 |
| B | 4 | 216 | 496215 | 349.7 | 7434 | 7257 | 1398.2 |
| B | 0 | 189 | 354181 | 248.12 | 7434 | 7257 | 1398.2 |
| C | 0 | 10 | 1659692 | 987.96 | 7078 | 7048 | 1672.8 |
| C | 7 | 247 | 322956 | 188.85 | 7078 | 7048 | 1672.8 |
| C | 0 | 239 | 169441 | 97.08 | 7078 | 7048 | 1672.8 |
| D | 1 | 52 | 25823148 | 15714.12 | 6966 | 6726 | 1642.9 |
| D | 7 | 238 | 4424208 | 2688.86 | 6966 | 6726 | 1642.9 |
| D | 13 | 172 | 3286714 | 1996.49 | 6966 | 6726 | 1642.9 |
Histogram calculated using DETX and DETY for each event in the final _common_clean file
| Quadrant A |  |
 |
Quadrant B |
|---|---|---|---|
| Quadrant D |  |
 |
Quadrant C |
| Plot type | Count rate plots | Images |
|---|---|---|
| Comparison with Poisson distribution Blue bars denote a histogram of data divided into 1 sec bins. Red curve is a Poisson curve with rate = median count rate of data. |
 |
 |
| Quadrant-wise count rates Data is divided into 100 sec bins |
 |
|
| Module-wise count rates for Quadrant A Data is divided into 100 sec bins |
 |
 |
| Module-wise count rates for Quadrant B Data is divided into 100 sec bins |
 |
 |
| Module-wise count rates for Quadrant C Data is divided into 100 sec bins |
 |
 |
| Module-wise count rates for Quadrant D Data is divided into 100 sec bins |
 |
 |
| Parameter | Plot |
|---|---|
| CZT HV Monitor |  |
| D_VDD |  |
| Temperature 1 |  |
| Veto HV Monitor |  |
| Veto LLD |  |
| Alpha Counter |  |
| _CPM_Rate |  |
| CZT Counter |  |
| +2.5 Volts monitor |  |
| +5 Volts monitor |  |
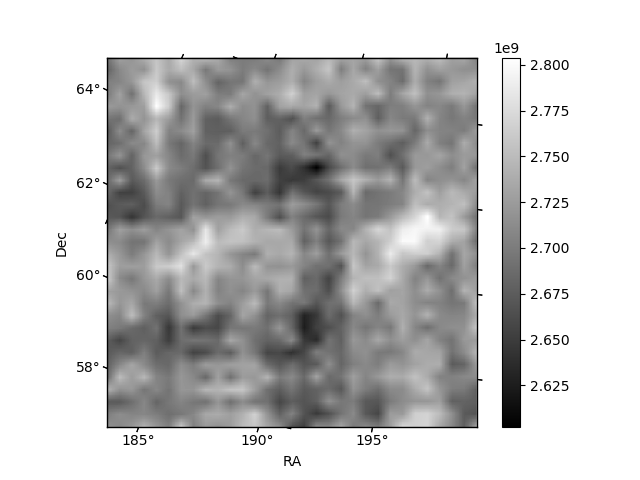
| _ROLL_ROT |  |
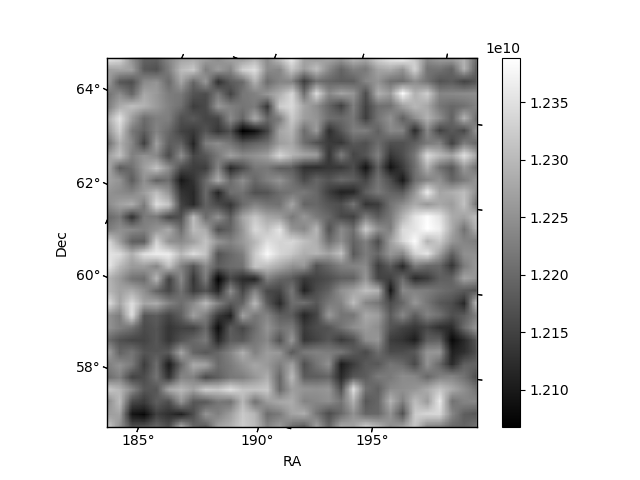
| _Roll_DEC |  |
| _Roll_RA | 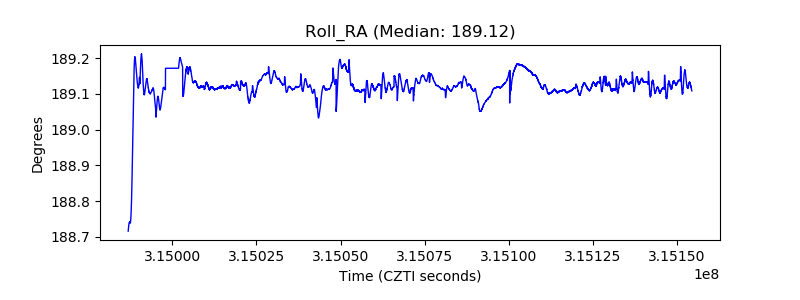 |
| Veto Counter |  |