| Param | Original file | Final file |
|---|---|---|
| Filename | modeM0/AS1T03_170T01_9000003388cztM0_level2_bc.evt | modeM0/AS1T03_170T01_9000003388cztM0_level2_quad_clean.evt |
| Size (bytes) | 2,739,686,400 | 927,921,600 |
| Size | 2.6 GB | 884.9 MB |
| Events in quadrant A | 15,338,331 | 5,951,044 |
| Events in quadrant B | 15,892,447 | 6,042,149 |
| Events in quadrant C | 15,796,973 | 5,793,865 |
| Events in quadrant D | 31,136,480 | 5,479,327 |
| Mode SS | |||
|---|---|---|---|
| Quadrant | BADHDUFLAG | Total packets | Discarded packets |
| A | 0 | 1436 | 0 |
| B | 0 | 1436 | 0 |
| C | 0 | 1436 | 0 |
| D | 0 | 1436 | 0 |
| Mode M9 | |||
|---|---|---|---|
| Quadrant | BADHDUFLAG | Total packets | Discarded packets |
| A | 0 | 115 | 0 |
| B | 0 | 115 | 0 |
| C | 0 | 115 | 0 |
| D | 0 | 115 | 0 |
| Mode M0 | |||
|---|---|---|---|
| Quadrant | BADHDUFLAG | Total packets | Discarded packets |
| A | 0 | 147018 | 0 |
| B | 0 | 148728 | 0 |
| C | 0 | 150693 | 0 |
| D | 0 | 205072 | 0 |
| Quadrant | Total seconds | Saturated seconds | Saturation percentage |
|---|---|---|---|
| A | 70578 | 802 | 1.136331% |
| B | 70578 | 916 | 1.297855% |
| C | 70578 | 1207 | 1.710165% |
| D | 70578 | 4065 | 5.759585% |
Noise dominated data is calculated using 1-second bins in cleaned event files. If a bin has >2000 counts, and if more than 50% of those come from <1% of pixels, then it is considered to be noise-dominated and hence unusable.
| Quadrant | # 1 sec bins | Bins with >0 counts | Bins with >2000 counts | High rate bins dominated by noise | Noise dominated (total time) | Noise dominated (detector-on time) | Marked lightcurve |
|---|---|---|---|---|---|---|---|
| A | 82144 | 70580 | 7 | 7 | 0.01% | 0.01% |  |
| B | 82144 | 70579 | 5 | 5 | 0.01% | 0.01% |  |
| C | 82144 | 70580 | 28 | 28 | 0.03% | 0.04% |  |
| D | 82144 | 70574 | 637 | 637 | 0.78% | 0.90% |  |
Top three noisy pixels from each quadrant. If the there are fewer than three noisy pixels in the level2.evt file, extra rows are filled as -1
| Pixel properties | Quadrant properties | ||||||
|---|---|---|---|---|---|---|---|
| Quadrant | DetID | PixID | Counts | Sigma | Mean | Median | Sigma |
| A | 0 | 23 | 502521 | 608.46 | 3800 | 3733 | 819.8 |
| A | 13 | 254 | 114876 | 135.58 | 3800 | 3733 | 819.8 |
| A | 4 | 2 | 101385 | 119.12 | 3800 | 3733 | 819.8 |
| B | 0 | 190 | 294931 | 405.01 | 3851 | 3758 | 718.9 |
| B | 3 | 64 | 162504 | 220.81 | 3851 | 3758 | 718.9 |
| B | 0 | 189 | 132550 | 179.14 | 3851 | 3758 | 718.9 |
| C | 6 | 80 | 1236223 | 1422.99 | 3687 | 3671 | 866.2 |
| C | 7 | 247 | 225409 | 256.0 | 3687 | 3671 | 866.2 |
| C | 10 | 9 | 141727 | 159.39 | 3687 | 3671 | 866.2 |
| D | 1 | 52 | 10471998 | 12151.02 | 3671 | 3541 | 861.5 |
| D | 7 | 238 | 1900921 | 2202.34 | 3671 | 3541 | 861.5 |
| D | 13 | 153 | 1537644 | 1780.67 | 3671 | 3541 | 861.5 |
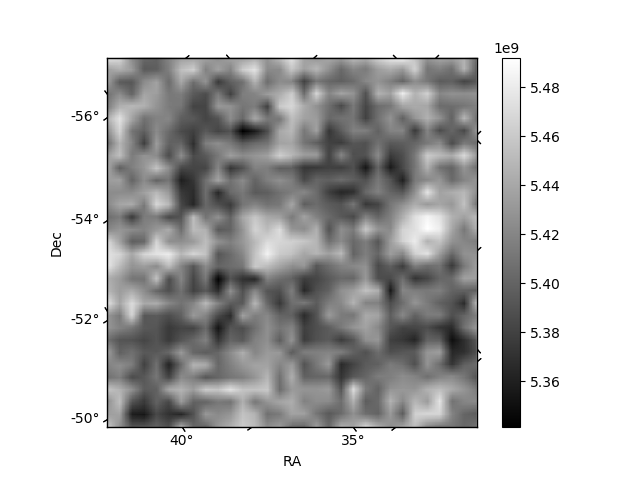
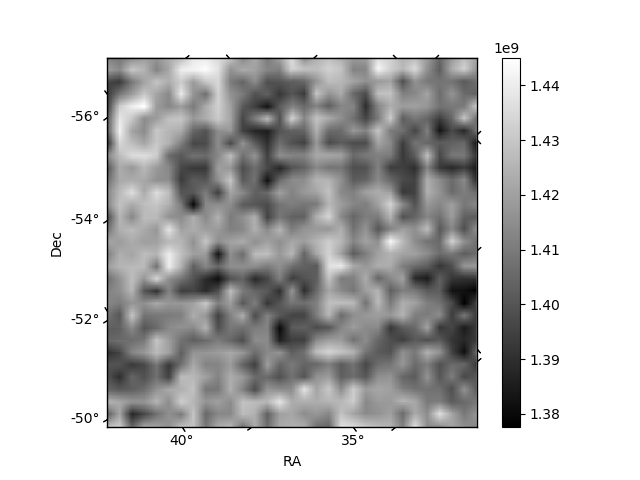
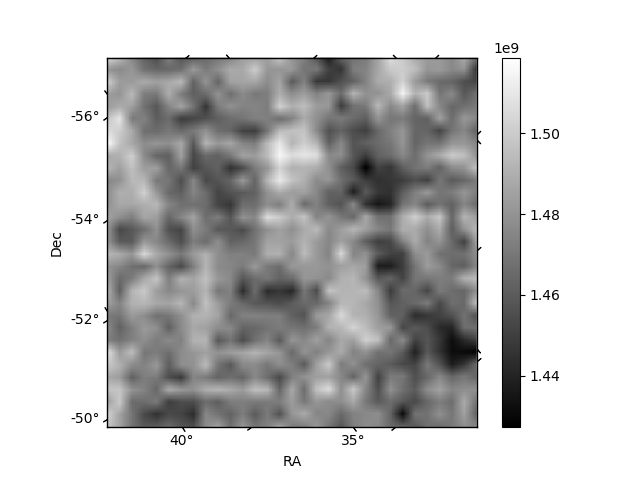
Histogram calculated using DETX and DETY for each event in the final _common_clean file
| Quadrant A |  |
 |
Quadrant B |
|---|---|---|---|
| Quadrant D |  |
 |
Quadrant C |
| Plot type | Count rate plots | Images |
|---|---|---|
| Comparison with Poisson distribution Blue bars denote a histogram of data divided into 1 sec bins. Red curve is a Poisson curve with rate = median count rate of data. |
 |
 |
| Quadrant-wise count rates Data is divided into 100 sec bins |
 |
|
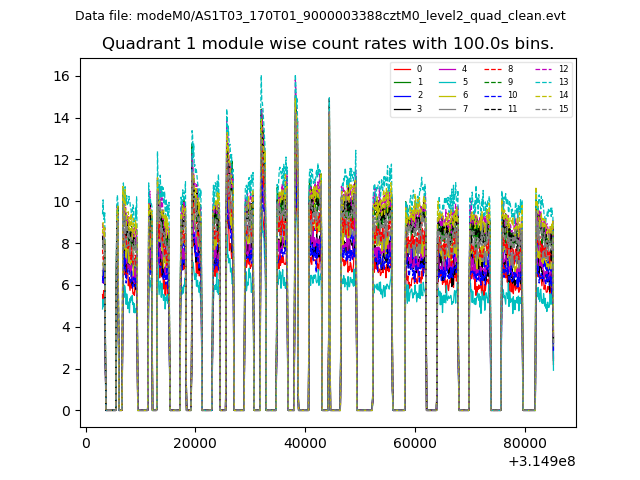
| Module-wise count rates for Quadrant A Data is divided into 100 sec bins |
 |
 |
| Module-wise count rates for Quadrant B Data is divided into 100 sec bins |
 |
 |
| Module-wise count rates for Quadrant C Data is divided into 100 sec bins |
 |
 |
| Module-wise count rates for Quadrant D Data is divided into 100 sec bins |
 |
 |
| Parameter | Plot |
|---|---|
| CZT HV Monitor | 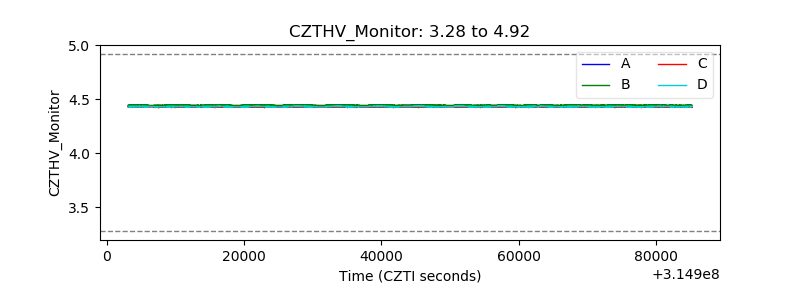 |
| D_VDD |  |
| Temperature 1 |  |
| Veto HV Monitor |  |
| Veto LLD |  |
| Alpha Counter | 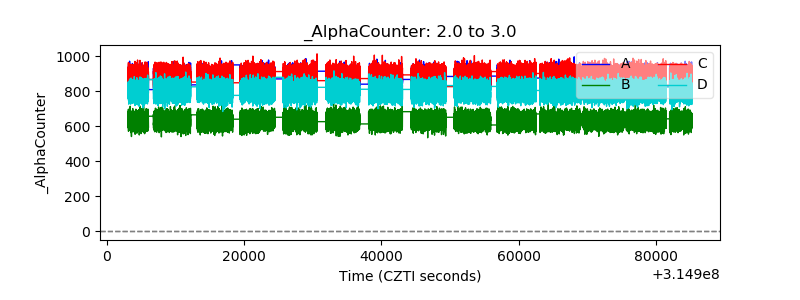 |
| _CPM_Rate |  |
| CZT Counter |  |
| +2.5 Volts monitor | 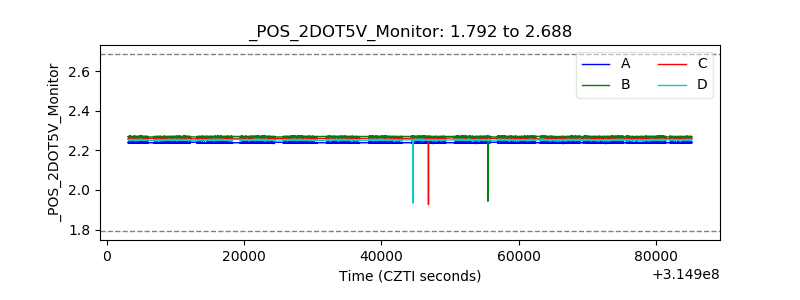 |
| +5 Volts monitor |  |
| _ROLL_ROT |  |
| _Roll_DEC | 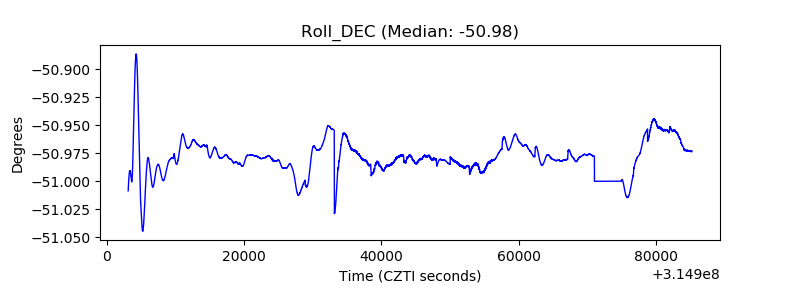 |
| _Roll_RA |  |
| Veto Counter | 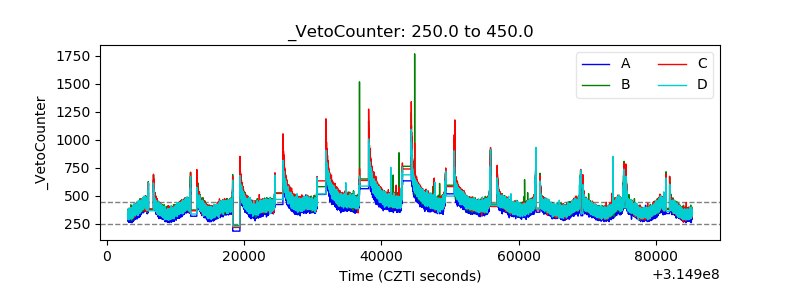 |