| Param | Original file | Final file |
|---|---|---|
| Filename | modeM0/AS1A07_047T09_9000003386cztM0_level2_bc.evt | modeM0/AS1A07_047T09_9000003386cztM0_level2_quad_clean.evt |
| Size (bytes) | 403,620,480 | 155,782,080 |
| Size | 384.9 MB | 148.6 MB |
| Events in quadrant A | 2,038,024 | 1,038,311 |
| Events in quadrant B | 2,235,443 | 1,044,789 |
| Events in quadrant C | 2,060,092 | 985,113 |
| Events in quadrant D | 5,177,767 | 933,114 |
| Mode M0 | |||
|---|---|---|---|
| Quadrant | BADHDUFLAG | Total packets | Discarded packets |
| A | 0 | 21002 | 0 |
| B | 0 | 21677 | 0 |
| C | 0 | 21245 | 0 |
| D | 0 | 32944 | 0 |
| Mode SS | |||
|---|---|---|---|
| Quadrant | BADHDUFLAG | Total packets | Discarded packets |
| A | 0 | 212 | 0 |
| B | 0 | 212 | 0 |
| C | 0 | 212 | 0 |
| D | 0 | 212 | 0 |
| Mode M9 | |||
|---|---|---|---|
| Quadrant | BADHDUFLAG | Total packets | Discarded packets |
| A | 0 | 10 | 0 |
| B | 0 | 10 | 0 |
| C | 0 | 10 | 0 |
| D | 0 | 10 | 0 |
| Quadrant | Total seconds | Saturated seconds | Saturation percentage |
|---|---|---|---|
| A | 10347 | 40 | 0.386585% |
| B | 10347 | 69 | 0.666860% |
| C | 10347 | 108 | 1.043781% |
| D | 10347 | 832 | 8.040978% |
Noise dominated data is calculated using 1-second bins in cleaned event files. If a bin has >2000 counts, and if more than 50% of those come from <1% of pixels, then it is considered to be noise-dominated and hence unusable.
| Quadrant | # 1 sec bins | Bins with >0 counts | Bins with >2000 counts | High rate bins dominated by noise | Noise dominated (total time) | Noise dominated (detector-on time) | Marked lightcurve |
|---|---|---|---|---|---|---|---|
| A | 11357 | 10347 | 0 | 0 | 0.00% | 0.00% |  |
| B | 11357 | 10347 | 2 | 2 | 0.02% | 0.02% |  |
| C | 11357 | 10347 | 0 | 0 | 0.00% | 0.00% |  |
| D | 11357 | 10347 | 61 | 61 | 0.54% | 0.59% |  |
Top three noisy pixels from each quadrant. If the there are fewer than three noisy pixels in the level2.evt file, extra rows are filled as -1
| Pixel properties | Quadrant properties | ||||||
|---|---|---|---|---|---|---|---|
| Quadrant | DetID | PixID | Counts | Sigma | Mean | Median | Sigma |
| A | 13 | 254 | 17845 | 146.91 | 520 | 508 | 118.0 |
| A | 0 | 23 | 15644 | 128.26 | 520 | 508 | 118.0 |
| A | 4 | 2 | 4312 | 32.23 | 520 | 508 | 118.0 |
| B | 0 | 190 | 94523 | 920.81 | 522 | 510 | 102.1 |
| B | 0 | 228 | 26791 | 257.41 | 522 | 510 | 102.1 |
| B | 0 | 230 | 26015 | 249.81 | 522 | 510 | 102.1 |
| C | 6 | 80 | 137583 | 1149.37 | 492 | 489 | 119.3 |
| C | 7 | 247 | 15792 | 128.3 | 492 | 489 | 119.3 |
| C | 8 | 128 | 4855 | 36.6 | 492 | 489 | 119.3 |
| D | 1 | 52 | 2019713 | 17076.9 | 489 | 470 | 118.2 |
| D | 13 | 172 | 692774 | 5854.87 | 489 | 470 | 118.2 |
| D | 12 | 233 | 171720 | 1448.27 | 489 | 470 | 118.2 |
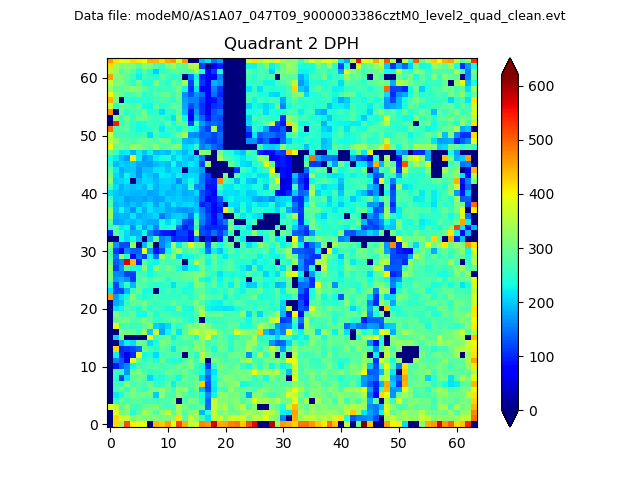
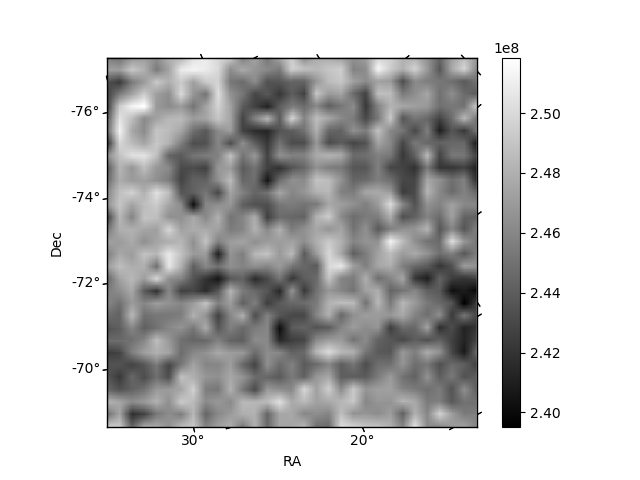
Histogram calculated using DETX and DETY for each event in the final _common_clean file
| Quadrant A | 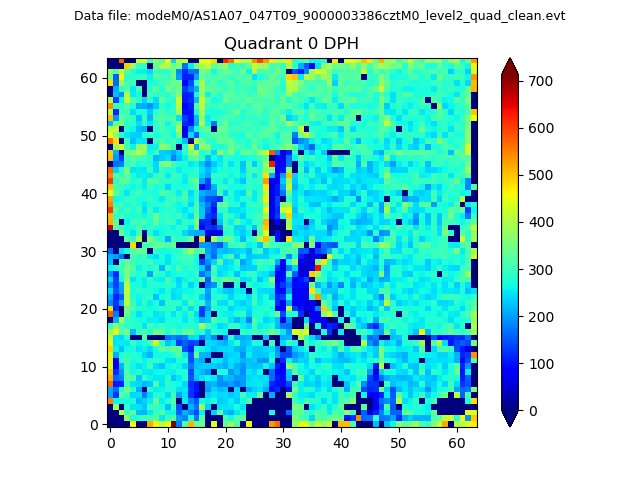 |
 |
Quadrant B |
|---|---|---|---|
| Quadrant D |  |
 |
Quadrant C |
| Plot type | Count rate plots | Images |
|---|---|---|
| Comparison with Poisson distribution Blue bars denote a histogram of data divided into 1 sec bins. Red curve is a Poisson curve with rate = median count rate of data. |
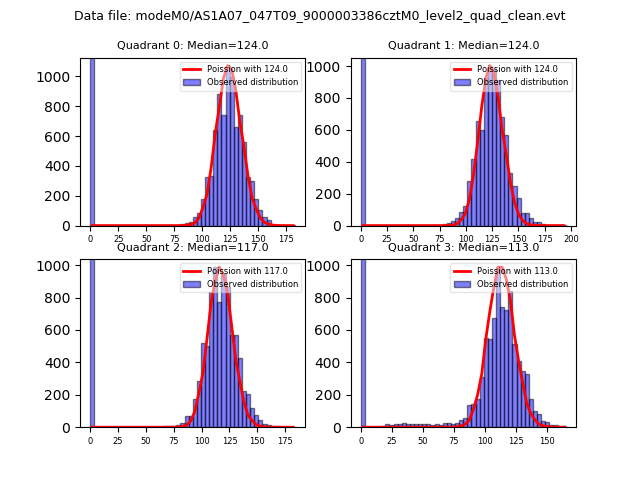 |
 |
| Quadrant-wise count rates Data is divided into 100 sec bins |
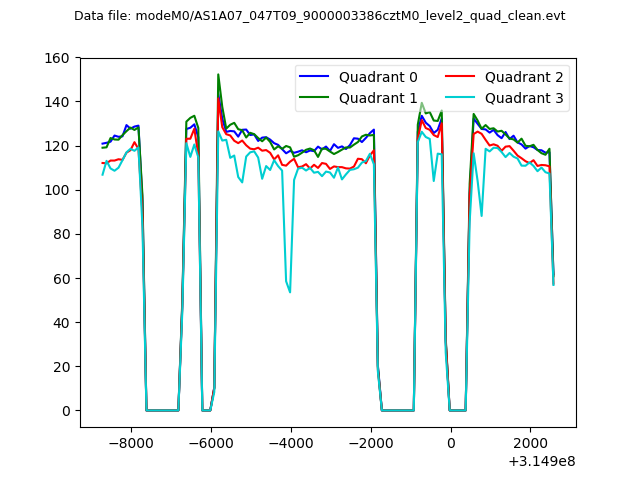 |
|
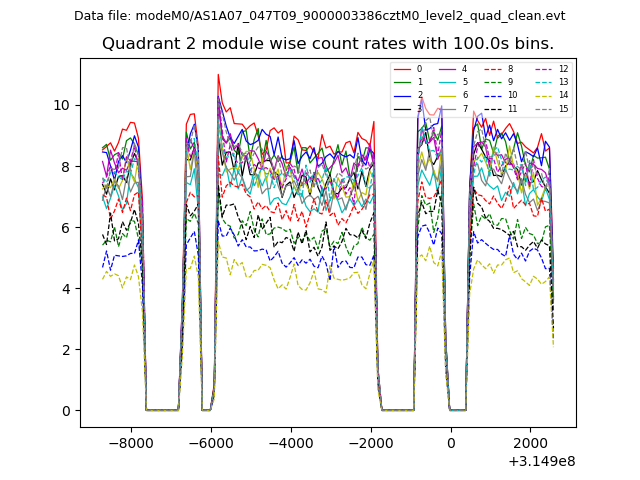
| Module-wise count rates for Quadrant A Data is divided into 100 sec bins |
 |
 |
| Module-wise count rates for Quadrant B Data is divided into 100 sec bins |
 |
 |
| Module-wise count rates for Quadrant C Data is divided into 100 sec bins |
 |
 |
| Module-wise count rates for Quadrant D Data is divided into 100 sec bins |
 |
 |
| Parameter | Plot |
|---|---|
| CZT HV Monitor | 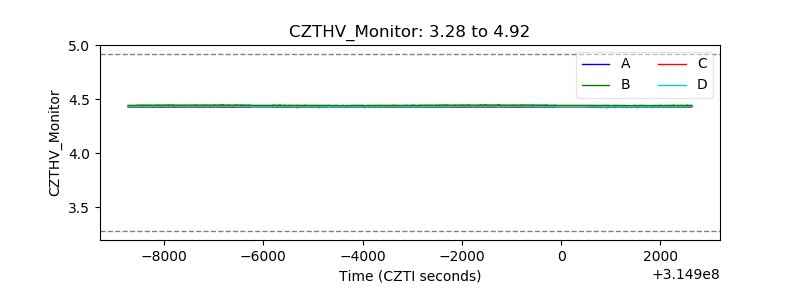 |
| D_VDD |  |
| Temperature 1 |  |
| Veto HV Monitor | 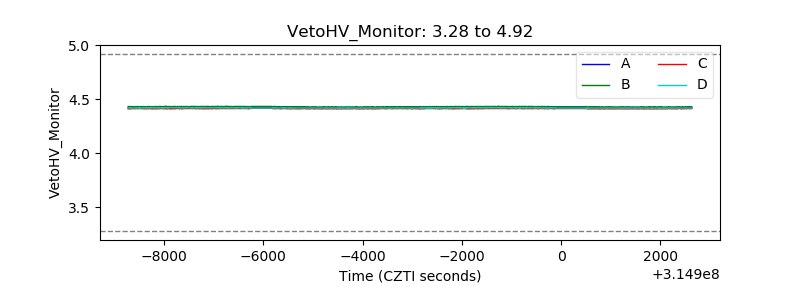 |
| Veto LLD | 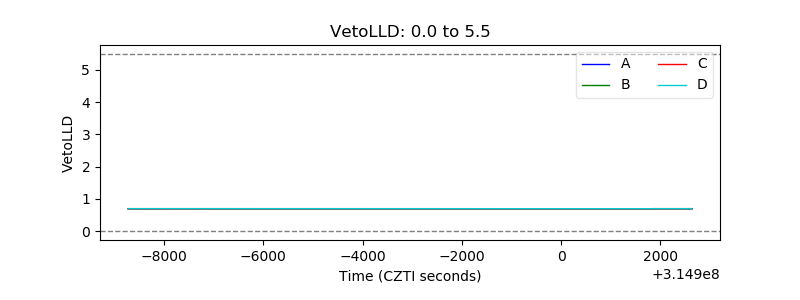 |
| Alpha Counter |  |
| _CPM_Rate | 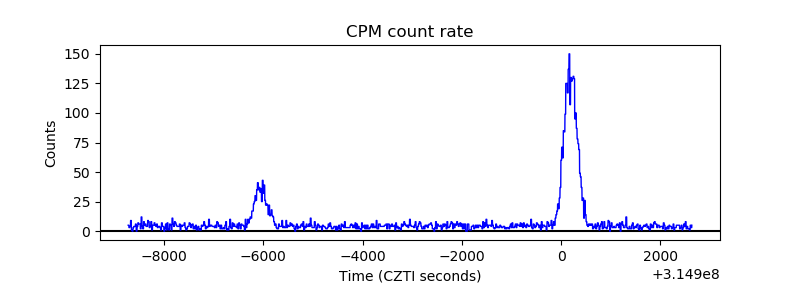 |
| CZT Counter | 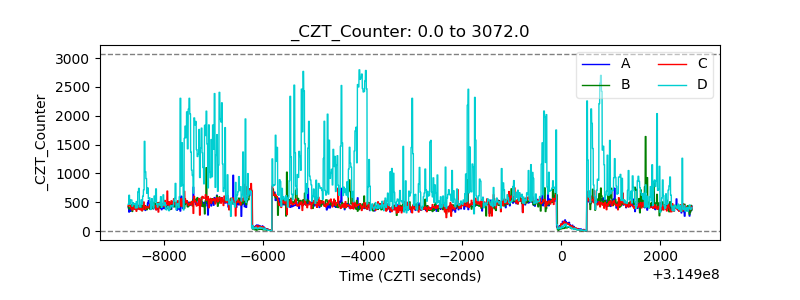 |
| +2.5 Volts monitor |  |
| +5 Volts monitor |  |
| _ROLL_ROT |  |
| _Roll_DEC | 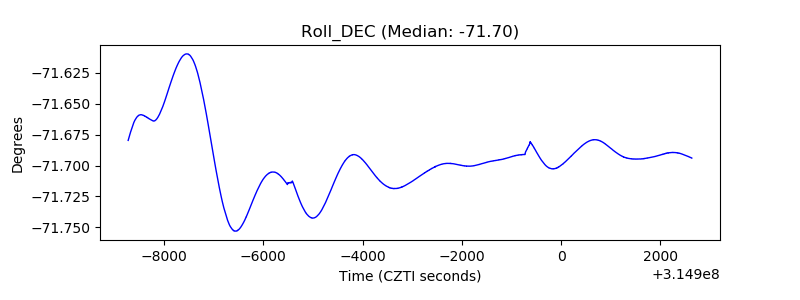 |
| _Roll_RA |  |
| Veto Counter |  |