| Param | Original file | Final file |
|---|---|---|
| Filename | modeM0/AS1C05_013T03_9000003376cztM0_level2_bc.evt | modeM0/AS1C05_013T03_9000003376cztM0_level2_quad_clean.evt |
| Size (bytes) | 390,810,240 | 151,905,600 |
| Size | 372.7 MB | 144.9 MB |
| Events in quadrant A | 1,770,172 | 1,039,120 |
| Events in quadrant B | 1,725,056 | 1,053,094 |
| Events in quadrant C | 1,614,809 | 1,014,182 |
| Events in quadrant D | 6,151,777 | 916,282 |
| Mode M9 | |||
|---|---|---|---|
| Quadrant | BADHDUFLAG | Total packets | Discarded packets |
| A | 0 | 12 | 0 |
| B | 0 | 12 | 0 |
| C | 0 | 12 | 0 |
| D | 0 | 12 | 0 |
| Mode M0 | |||
|---|---|---|---|
| Quadrant | BADHDUFLAG | Total packets | Discarded packets |
| A | 0 | 17145 | 0 |
| B | 0 | 17293 | 0 |
| C | 0 | 17108 | 0 |
| D | 0 | 30483 | 0 |
| Mode SS | |||
|---|---|---|---|
| Quadrant | BADHDUFLAG | Total packets | Discarded packets |
| A | 0 | 168 | 0 |
| B | 0 | 168 | 0 |
| C | 0 | 168 | 0 |
| D | 0 | 168 | 0 |
| Quadrant | Total seconds | Saturated seconds | Saturation percentage |
|---|---|---|---|
| A | 8320 | 25 | 0.300481% |
| B | 8320 | 46 | 0.552885% |
| C | 8320 | 69 | 0.829327% |
| D | 8320 | 1629 | 19.579327% |
Noise dominated data is calculated using 1-second bins in cleaned event files. If a bin has >2000 counts, and if more than 50% of those come from <1% of pixels, then it is considered to be noise-dominated and hence unusable.
| Quadrant | # 1 sec bins | Bins with >0 counts | Bins with >2000 counts | High rate bins dominated by noise | Noise dominated (total time) | Noise dominated (detector-on time) | Marked lightcurve |
|---|---|---|---|---|---|---|---|
| A | 9090 | 8320 | 0 | 0 | 0.00% | 0.00% | 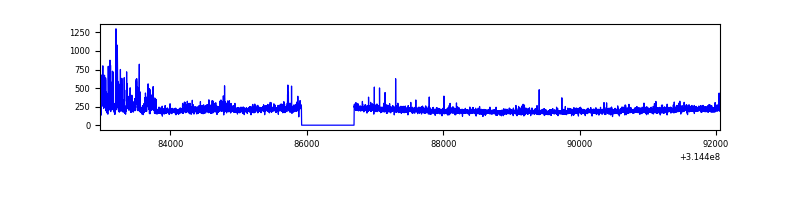 |
| B | 9090 | 8320 | 0 | 0 | 0.00% | 0.00% | 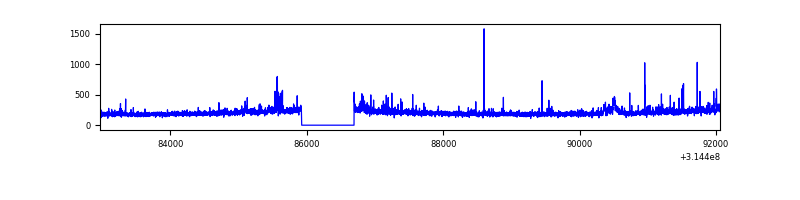 |
| C | 9090 | 8320 | 0 | 0 | 0.00% | 0.00% |  |
| D | 9090 | 8320 | 1153 | 1153 | 12.68% | 13.86% | 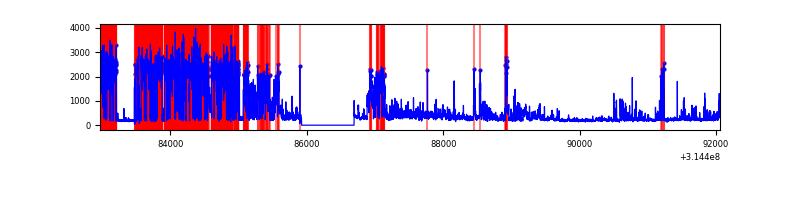 |
Top three noisy pixels from each quadrant. If the there are fewer than three noisy pixels in the level2.evt file, extra rows are filled as -1
| Pixel properties | Quadrant properties | ||||||
|---|---|---|---|---|---|---|---|
| Quadrant | DetID | PixID | Counts | Sigma | Mean | Median | Sigma |
| A | 11 | 47 | 128689 | 1375.03 | 417 | 409 | 93.3 |
| A | 13 | 252 | 20187 | 212.0 | 417 | 409 | 93.3 |
| A | 13 | 254 | 14124 | 147.01 | 417 | 409 | 93.3 |
| B | 0 | 190 | 43239 | 514.13 | 420 | 409 | 83.3 |
| B | 0 | 229 | 34043 | 403.74 | 420 | 409 | 83.3 |
| B | 0 | 228 | 8921 | 102.18 | 420 | 409 | 83.3 |
| C | 7 | 247 | 49506 | 499.18 | 403 | 399 | 98.4 |
| C | 2 | 16 | 14169 | 139.98 | 403 | 399 | 98.4 |
| C | 13 | 61 | 2277 | 19.09 | 403 | 399 | 98.4 |
| D | 1 | 52 | 3982220 | 41524.77 | 387 | 372 | 95.9 |
| D | 1 | 239 | 386942 | 4031.35 | 387 | 372 | 95.9 |
| D | 9 | 85 | 83249 | 864.28 | 387 | 372 | 95.9 |
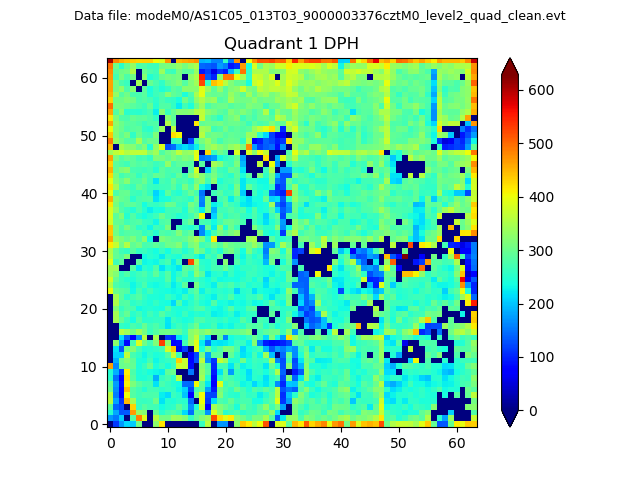
Histogram calculated using DETX and DETY for each event in the final _common_clean file
| Quadrant A | 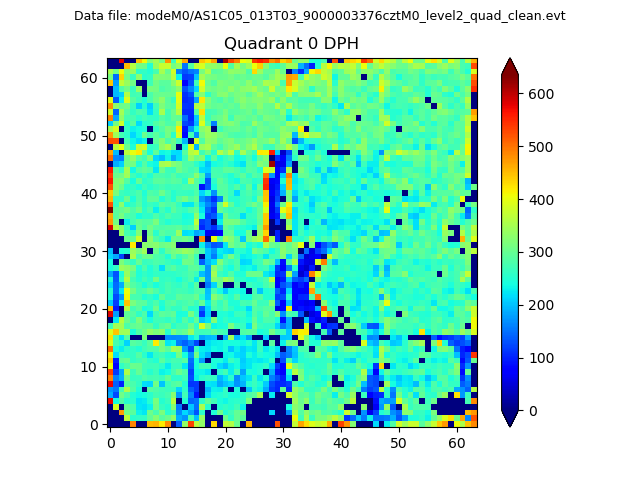 |
 |
Quadrant B |
|---|---|---|---|
| Quadrant D |  |
 |
Quadrant C |
| Plot type | Count rate plots | Images |
|---|---|---|
| Comparison with Poisson distribution Blue bars denote a histogram of data divided into 1 sec bins. Red curve is a Poisson curve with rate = median count rate of data. |
 |
 |
| Quadrant-wise count rates Data is divided into 100 sec bins |
 |
|
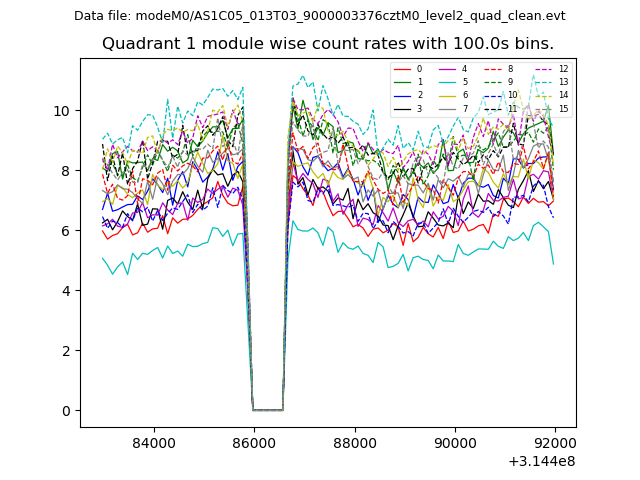
| Module-wise count rates for Quadrant A Data is divided into 100 sec bins |
 |
 |
| Module-wise count rates for Quadrant B Data is divided into 100 sec bins |
 |
 |
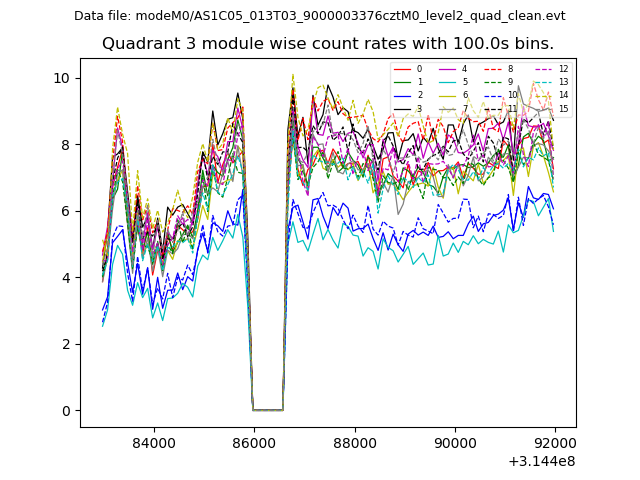
| Module-wise count rates for Quadrant C Data is divided into 100 sec bins |
 |
 |
| Module-wise count rates for Quadrant D Data is divided into 100 sec bins |
 |
 |
| Parameter | Plot |
|---|---|
| CZT HV Monitor | 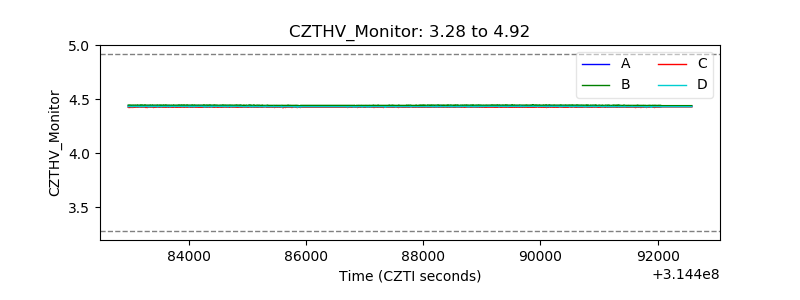 |
| D_VDD | 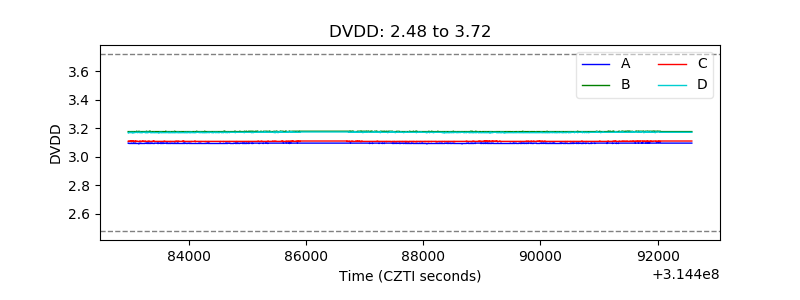 |
| Temperature 1 |  |
| Veto HV Monitor |  |
| Veto LLD | 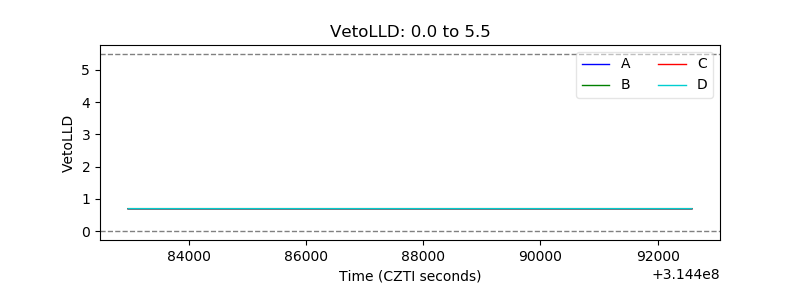 |
| Alpha Counter |  |
| _CPM_Rate |  |
| CZT Counter |  |
| +2.5 Volts monitor |  |
| +5 Volts monitor | 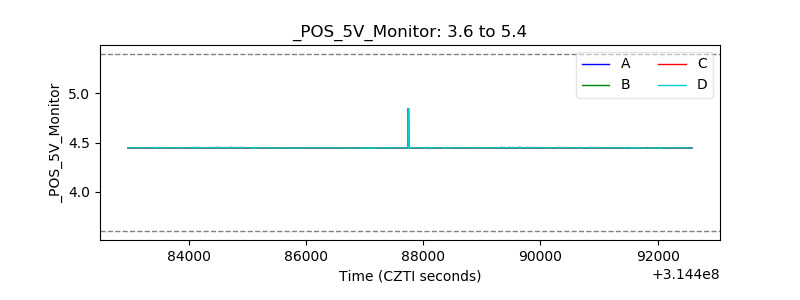 |
| _ROLL_ROT |  |
| _Roll_DEC |  |
| _Roll_RA |  |
| Veto Counter |  |