| Param | Original file | Final file |
|---|---|---|
| Filename | modeM0/AS1A07_054T01_9000003378cztM0_level2_bc.evt | modeM0/AS1A07_054T01_9000003378cztM0_level2_quad_clean.evt |
| Size (bytes) | 3,697,770,240 | 1,874,946,240 |
| Size | 3.4 GB | 1.7 GB |
| Events in quadrant A | 21,525,992 | 13,050,407 |
| Events in quadrant B | 21,111,325 | 13,057,893 |
| Events in quadrant C | 19,311,836 | 12,325,160 |
| Events in quadrant D | 43,510,541 | 11,792,625 |
| Mode M9 | |||
|---|---|---|---|
| Quadrant | BADHDUFLAG | Total packets | Discarded packets |
| A | 0 | 168 | 0 |
| B | 0 | 169 | 0 |
| C | 0 | 169 | 0 |
| D | 0 | 169 | 0 |
| Mode SS | |||
|---|---|---|---|
| Quadrant | BADHDUFLAG | Total packets | Discarded packets |
| A | 0 | 1954 | 0 |
| B | 0 | 1954 | 0 |
| C | 0 | 1954 | 0 |
| D | 0 | 1954 | 0 |
| Mode M0 | |||
|---|---|---|---|
| Quadrant | BADHDUFLAG | Total packets | Discarded packets |
| A | 0 | 198870 | 0 |
| B | 0 | 199492 | 0 |
| C | 0 | 196739 | 0 |
| D | 0 | 279038 | 0 |
| Quadrant | Total seconds | Saturated seconds | Saturation percentage |
|---|---|---|---|
| A | 95868 | 589 | 0.614386% |
| B | 95867 | 764 | 0.796937% |
| C | 95867 | 1074 | 1.120302% |
| D | 95867 | 6139 | 6.403663% |
Noise dominated data is calculated using 1-second bins in cleaned event files. If a bin has >2000 counts, and if more than 50% of those come from <1% of pixels, then it is considered to be noise-dominated and hence unusable.
| Quadrant | # 1 sec bins | Bins with >0 counts | Bins with >2000 counts | High rate bins dominated by noise | Noise dominated (total time) | Noise dominated (detector-on time) | Marked lightcurve |
|---|---|---|---|---|---|---|---|
| A | 117189 | 95873 | 5 | 5 | 0.00% | 0.01% | 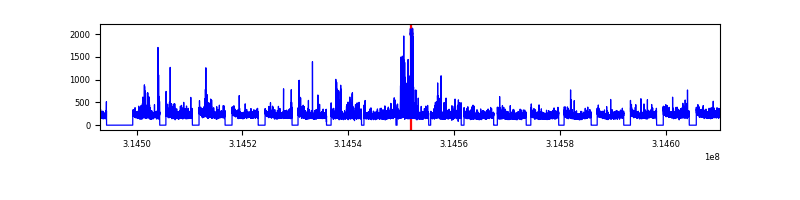 |
| B | 117189 | 95868 | 7 | 7 | 0.01% | 0.01% |  |
| C | 117189 | 95868 | 0 | 0 | 0.00% | 0.00% |  |
| D | 117189 | 95863 | 969 | 969 | 0.83% | 1.01% |  |
Top three noisy pixels from each quadrant. If the there are fewer than three noisy pixels in the level2.evt file, extra rows are filled as -1
| Pixel properties | Quadrant properties | ||||||
|---|---|---|---|---|---|---|---|
| Quadrant | DetID | PixID | Counts | Sigma | Mean | Median | Sigma |
| A | 11 | 47 | 747584 | 653.66 | 5233 | 5157 | 1135.8 |
| A | 13 | 252 | 459320 | 399.86 | 5233 | 5157 | 1135.8 |
| A | 13 | 254 | 151436 | 128.79 | 5233 | 5157 | 1135.8 |
| B | 0 | 190 | 416368 | 419.34 | 5213 | 5098 | 980.8 |
| B | 0 | 189 | 255162 | 254.97 | 5213 | 5098 | 980.8 |
| B | 0 | 229 | 141501 | 139.08 | 5213 | 5098 | 980.8 |
| C | 10 | 22 | 140744 | 117.0 | 4917 | 4913 | 1160.9 |
| C | 7 | 247 | 105383 | 86.54 | 4917 | 4913 | 1160.9 |
| C | 0 | 239 | 66204 | 52.79 | 4917 | 4913 | 1160.9 |
| D | 7 | 238 | 14422391 | 12290.57 | 4961 | 4800 | 1173.1 |
| D | 1 | 52 | 3388464 | 2884.47 | 4961 | 4800 | 1173.1 |
| D | 13 | 153 | 1151620 | 977.63 | 4961 | 4800 | 1173.1 |
Histogram calculated using DETX and DETY for each event in the final _common_clean file
| Quadrant A | 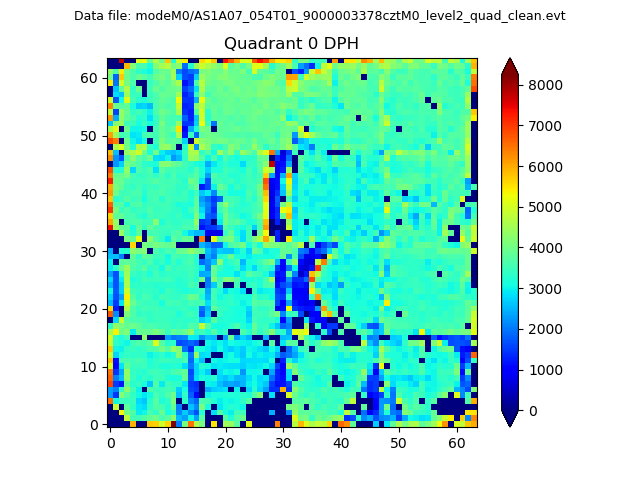 |
 |
Quadrant B |
|---|---|---|---|
| Quadrant D |  |
 |
Quadrant C |
| Plot type | Count rate plots | Images |
|---|---|---|
| Comparison with Poisson distribution Blue bars denote a histogram of data divided into 1 sec bins. Red curve is a Poisson curve with rate = median count rate of data. |
 |
 |
| Quadrant-wise count rates Data is divided into 100 sec bins |
 |
|
| Module-wise count rates for Quadrant A Data is divided into 100 sec bins |
 |
 |
| Module-wise count rates for Quadrant B Data is divided into 100 sec bins |
 |
 |
| Module-wise count rates for Quadrant C Data is divided into 100 sec bins |
 |
 |
| Module-wise count rates for Quadrant D Data is divided into 100 sec bins |
 |
 |
| Parameter | Plot |
|---|---|
| CZT HV Monitor |  |
| D_VDD |  |
| Temperature 1 | 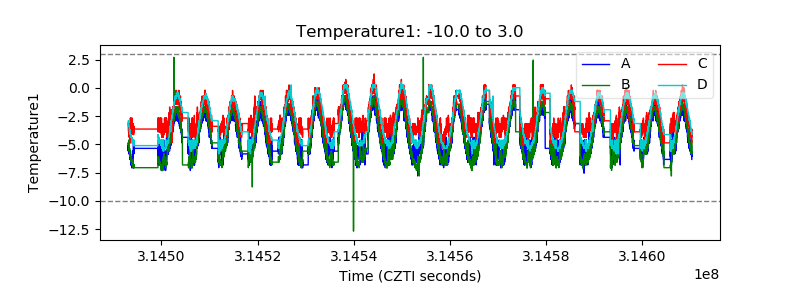 |
| Veto HV Monitor |  |
| Veto LLD |  |
| Alpha Counter |  |
| _CPM_Rate |  |
| CZT Counter |  |
| +2.5 Volts monitor |  |
| +5 Volts monitor |  |
| _ROLL_ROT | 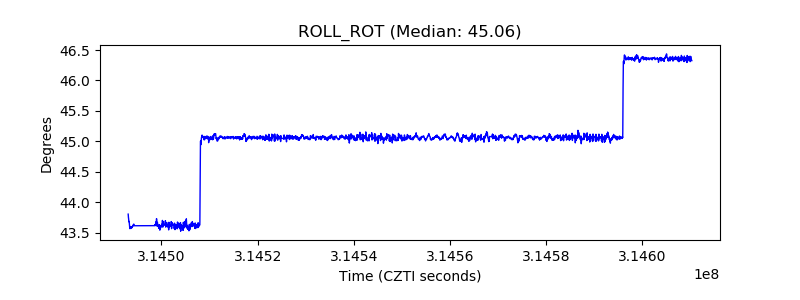 |
| _Roll_DEC |  |
| _Roll_RA |  |
| Veto Counter |  |