| Param | Original file | Final file |
|---|---|---|
| Filename | modeM0/AS1C05_001T01_9000003374cztM0_level2_bc.evt | modeM0/AS1C05_001T01_9000003374cztM0_level2_quad_clean.evt |
| Size (bytes) | 2,955,110,400 | 1,404,918,720 |
| Size | 2.8 GB | 1.3 GB |
| Events in quadrant A | 17,796,739 | 9,689,380 |
| Events in quadrant B | 16,742,567 | 9,788,977 |
| Events in quadrant C | 14,568,795 | 9,381,025 |
| Events in quadrant D | 35,562,408 | 8,838,242 |
| Mode SS | |||
|---|---|---|---|
| Quadrant | BADHDUFLAG | Total packets | Discarded packets |
| A | 0 | 1450 | 0 |
| B | 0 | 1450 | 0 |
| C | 0 | 1450 | 0 |
| D | 0 | 1450 | 0 |
| Mode M0 | |||
|---|---|---|---|
| Quadrant | BADHDUFLAG | Total packets | Discarded packets |
| A | 0 | 153935 | 0 |
| B | 0 | 152010 | 0 |
| C | 0 | 147475 | 0 |
| D | 0 | 214176 | 0 |
| Mode M9 | |||
|---|---|---|---|
| Quadrant | BADHDUFLAG | Total packets | Discarded packets |
| A | 0 | 112 | 0 |
| B | 0 | 112 | 0 |
| C | 0 | 112 | 0 |
| D | 0 | 112 | 0 |
| Quadrant | Total seconds | Saturated seconds | Saturation percentage |
|---|---|---|---|
| A | 70867 | 772 | 1.089365% |
| B | 70868 | 980 | 1.382853% |
| C | 70868 | 1142 | 1.611447% |
| D | 70868 | 5005 | 7.062426% |
Noise dominated data is calculated using 1-second bins in cleaned event files. If a bin has >2000 counts, and if more than 50% of those come from <1% of pixels, then it is considered to be noise-dominated and hence unusable.
| Quadrant | # 1 sec bins | Bins with >0 counts | Bins with >2000 counts | High rate bins dominated by noise | Noise dominated (total time) | Noise dominated (detector-on time) | Marked lightcurve |
|---|---|---|---|---|---|---|---|
| A | 82223 | 70870 | 1 | 1 | 0.00% | 0.00% | 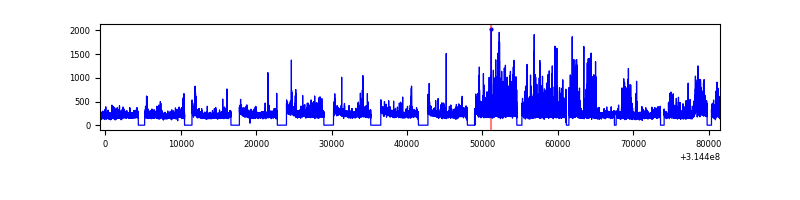 |
| B | 82223 | 70868 | 8 | 8 | 0.01% | 0.01% |  |
| C | 82223 | 70871 | 2 | 2 | 0.00% | 0.00% |  |
| D | 82223 | 70866 | 1386 | 1386 | 1.69% | 1.96% |  |
Top three noisy pixels from each quadrant. If the there are fewer than three noisy pixels in the level2.evt file, extra rows are filled as -1
| Pixel properties | Quadrant properties | ||||||
|---|---|---|---|---|---|---|---|
| Quadrant | DetID | PixID | Counts | Sigma | Mean | Median | Sigma |
| A | 11 | 47 | 2450117 | 2891.99 | 3907 | 3849 | 845.9 |
| A | 13 | 252 | 206973 | 240.13 | 3907 | 3849 | 845.9 |
| A | 13 | 254 | 122753 | 140.57 | 3907 | 3849 | 845.9 |
| B | 0 | 190 | 786682 | 1069.25 | 3927 | 3849 | 732.1 |
| B | 4 | 21 | 171158 | 228.52 | 3927 | 3849 | 732.1 |
| B | 0 | 230 | 148386 | 197.42 | 3927 | 3849 | 732.1 |
| C | 0 | 10 | 61314 | 65.67 | 3744 | 3743 | 876.6 |
| C | 7 | 247 | 48915 | 51.53 | 3744 | 3743 | 876.6 |
| C | 0 | 239 | 41702 | 43.3 | 3744 | 3743 | 876.6 |
| D | 1 | 52 | 7921113 | 9056.44 | 3740 | 3626 | 874.2 |
| D | 7 | 238 | 7142547 | 8165.88 | 3740 | 3626 | 874.2 |
| D | 1 | 239 | 2531841 | 2891.91 | 3740 | 3626 | 874.2 |
Histogram calculated using DETX and DETY for each event in the final _common_clean file
| Quadrant A |  |
 |
Quadrant B |
|---|---|---|---|
| Quadrant D |  |
 |
Quadrant C |
| Plot type | Count rate plots | Images |
|---|---|---|
| Comparison with Poisson distribution Blue bars denote a histogram of data divided into 1 sec bins. Red curve is a Poisson curve with rate = median count rate of data. |
 |
 |
| Quadrant-wise count rates Data is divided into 100 sec bins |
 |
|
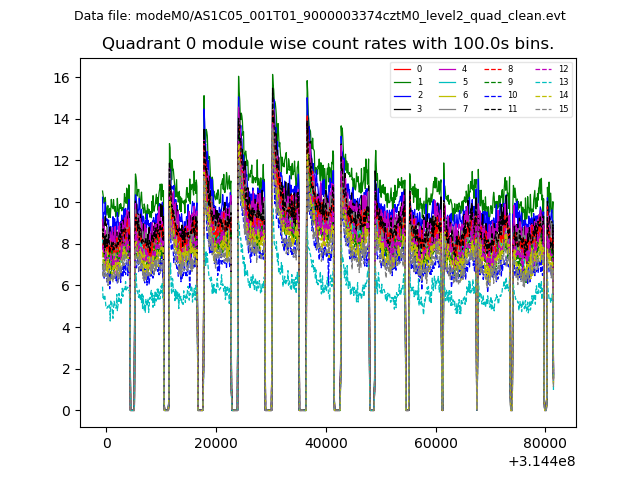
| Module-wise count rates for Quadrant A Data is divided into 100 sec bins |
 |
 |
| Module-wise count rates for Quadrant B Data is divided into 100 sec bins |
 |
 |
| Module-wise count rates for Quadrant C Data is divided into 100 sec bins |
 |
 |
| Module-wise count rates for Quadrant D Data is divided into 100 sec bins |
 |
 |
| Parameter | Plot |
|---|---|
| CZT HV Monitor |  |
| D_VDD |  |
| Temperature 1 |  |
| Veto HV Monitor |  |
| Veto LLD |  |
| Alpha Counter |  |
| _CPM_Rate | 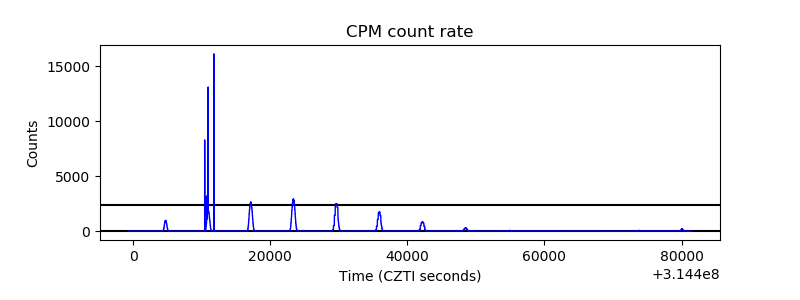 |
| CZT Counter | 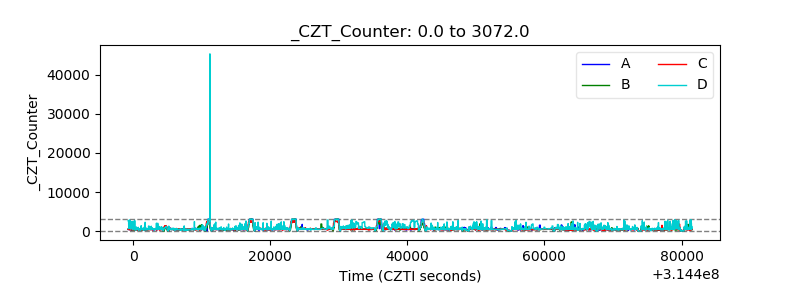 |
| +2.5 Volts monitor | 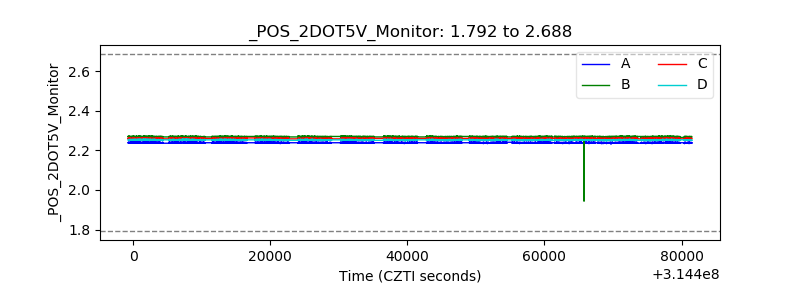 |
| +5 Volts monitor | 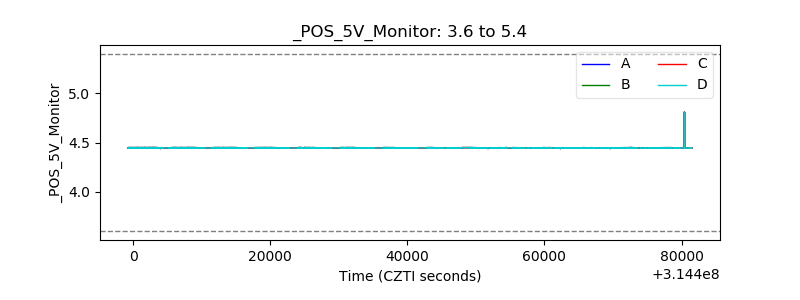 |
| _ROLL_ROT |  |
| _Roll_DEC |  |
| _Roll_RA |  |
| Veto Counter |  |