| Param | Original file | Final file |
|---|---|---|
| Filename | modeM0/AS1A07_054T01_9000003370cztM0_level2_bc.evt | modeM0/AS1A07_054T01_9000003370cztM0_level2_quad_clean.evt |
| Size (bytes) | 2,920,040,640 | 1,567,336,320 |
| Size | 2.7 GB | 1.5 GB |
| Events in quadrant A | 17,058,377 | 10,907,852 |
| Events in quadrant B | 17,605,420 | 10,846,096 |
| Events in quadrant C | 16,094,805 | 10,268,279 |
| Events in quadrant D | 32,280,614 | 10,028,406 |
| Mode M0 | |||
|---|---|---|---|
| Quadrant | BADHDUFLAG | Total packets | Discarded packets |
| A | 0 | 162594 | 0 |
| B | 0 | 165342 | 0 |
| C | 0 | 162641 | 0 |
| D | 0 | 218366 | 0 |
| Mode SS | |||
|---|---|---|---|
| Quadrant | BADHDUFLAG | Total packets | Discarded packets |
| A | 0 | 1614 | 0 |
| B | 0 | 1614 | 0 |
| C | 0 | 1614 | 0 |
| D | 0 | 1614 | 0 |
| Mode M9 | |||
|---|---|---|---|
| Quadrant | BADHDUFLAG | Total packets | Discarded packets |
| A | 0 | 125 | 0 |
| B | 0 | 125 | 0 |
| C | 0 | 125 | 0 |
| D | 0 | 125 | 0 |
| Quadrant | Total seconds | Saturated seconds | Saturation percentage |
|---|---|---|---|
| A | 79175 | 518 | 0.654247% |
| B | 79175 | 763 | 0.963688% |
| C | 79175 | 1017 | 1.284496% |
| D | 79175 | 4167 | 5.263025% |
Noise dominated data is calculated using 1-second bins in cleaned event files. If a bin has >2000 counts, and if more than 50% of those come from <1% of pixels, then it is considered to be noise-dominated and hence unusable.
| Quadrant | # 1 sec bins | Bins with >0 counts | Bins with >2000 counts | High rate bins dominated by noise | Noise dominated (total time) | Noise dominated (detector-on time) | Marked lightcurve |
|---|---|---|---|---|---|---|---|
| A | 91760 | 79174 | 0 | 0 | 0.00% | 0.00% |  |
| B | 91760 | 79175 | 3 | 3 | 0.00% | 0.00% |  |
| C | 91760 | 79175 | 1 | 1 | 0.00% | 0.00% |  |
| D | 91760 | 79173 | 536 | 536 | 0.58% | 0.68% |  |
Top three noisy pixels from each quadrant. If the there are fewer than three noisy pixels in the level2.evt file, extra rows are filled as -1
| Pixel properties | Quadrant properties | ||||||
|---|---|---|---|---|---|---|---|
| Quadrant | DetID | PixID | Counts | Sigma | Mean | Median | Sigma |
| A | 13 | 254 | 139692 | 143.23 | 4364 | 4302 | 945.3 |
| A | 13 | 252 | 133462 | 136.64 | 4364 | 4302 | 945.3 |
| A | 11 | 47 | 94501 | 95.42 | 4364 | 4302 | 945.3 |
| B | 0 | 190 | 313142 | 380.18 | 4323 | 4234 | 812.5 |
| B | 0 | 230 | 211765 | 255.41 | 4323 | 4234 | 812.5 |
| B | 0 | 229 | 131497 | 156.62 | 4323 | 4234 | 812.5 |
| C | 0 | 207 | 95796 | 95.11 | 4102 | 4097 | 964.2 |
| C | 10 | 22 | 88344 | 87.38 | 4102 | 4097 | 964.2 |
| C | 2 | 16 | 73182 | 71.65 | 4102 | 4097 | 964.2 |
| D | 1 | 52 | 12655119 | 12832.9 | 4189 | 4059 | 985.8 |
| D | 13 | 172 | 744434 | 751.02 | 4189 | 4059 | 985.8 |
| D | 2 | 152 | 664169 | 669.6 | 4189 | 4059 | 985.8 |
Histogram calculated using DETX and DETY for each event in the final _common_clean file
| Quadrant A |  |
 |
Quadrant B |
|---|---|---|---|
| Quadrant D |  |
 |
Quadrant C |
| Plot type | Count rate plots | Images |
|---|---|---|
| Comparison with Poisson distribution Blue bars denote a histogram of data divided into 1 sec bins. Red curve is a Poisson curve with rate = median count rate of data. |
 |
 |
| Quadrant-wise count rates Data is divided into 100 sec bins |
 |
|
| Module-wise count rates for Quadrant A Data is divided into 100 sec bins |
 |
 |
| Module-wise count rates for Quadrant B Data is divided into 100 sec bins |
 |
 |
| Module-wise count rates for Quadrant C Data is divided into 100 sec bins |
 |
 |
| Module-wise count rates for Quadrant D Data is divided into 100 sec bins |
 |
 |
| Parameter | Plot |
|---|---|
| CZT HV Monitor |  |
| D_VDD |  |
| Temperature 1 |  |
| Veto HV Monitor |  |
| Veto LLD |  |
| Alpha Counter |  |
| _CPM_Rate |  |
| CZT Counter | 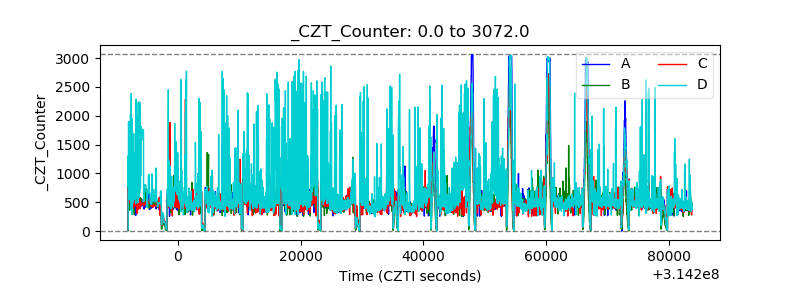 |
| +2.5 Volts monitor |  |
| +5 Volts monitor |  |
| _ROLL_ROT |  |
| _Roll_DEC |  |
| _Roll_RA | 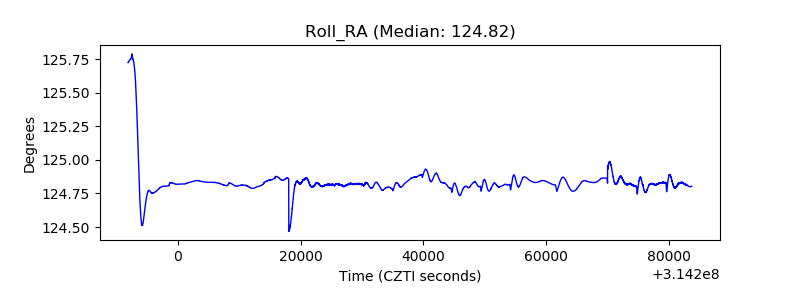 |
| Veto Counter |  |