| Param | Original file | Final file |
|---|---|---|
| Filename | modeM0/AS1T03_168T01_9000003368cztM0_level2_bc.evt | modeM0/AS1T03_168T01_9000003368cztM0_level2_quad_clean.evt |
| Size (bytes) | 5,177,136,960 | 2,848,397,760 |
| Size | 4.8 GB | 2.7 GB |
| Events in quadrant A | 30,865,071 | 19,675,029 |
| Events in quadrant B | 32,464,138 | 19,849,885 |
| Events in quadrant C | 30,480,415 | 18,935,092 |
| Events in quadrant D | 53,373,522 | 18,159,657 |
| Mode SS | |||
|---|---|---|---|
| Quadrant | BADHDUFLAG | Total packets | Discarded packets |
| A | 0 | 2864 | 0 |
| B | 0 | 2864 | 0 |
| C | 0 | 2864 | 0 |
| D | 0 | 2864 | 0 |
| Mode M9 | |||
|---|---|---|---|
| Quadrant | BADHDUFLAG | Total packets | Discarded packets |
| A | 0 | 229 | 0 |
| B | 0 | 229 | 0 |
| C | 0 | 229 | 0 |
| D | 0 | 229 | 0 |
| Mode M0 | |||
|---|---|---|---|
| Quadrant | BADHDUFLAG | Total packets | Discarded packets |
| A | 0 | 293016 | 0 |
| B | 0 | 298326 | 0 |
| C | 0 | 298384 | 0 |
| D | 0 | 373693 | 0 |
| Quadrant | Total seconds | Saturated seconds | Saturation percentage |
|---|---|---|---|
| A | 141143 | 1339 | 0.948683% |
| B | 141143 | 1673 | 1.185323% |
| C | 141143 | 2523 | 1.787549% |
| D | 141143 | 6592 | 4.670441% |
Noise dominated data is calculated using 1-second bins in cleaned event files. If a bin has >2000 counts, and if more than 50% of those come from <1% of pixels, then it is considered to be noise-dominated and hence unusable.
| Quadrant | # 1 sec bins | Bins with >0 counts | Bins with >2000 counts | High rate bins dominated by noise | Noise dominated (total time) | Noise dominated (detector-on time) | Marked lightcurve |
|---|---|---|---|---|---|---|---|
| A | 163533 | 141148 | 0 | 0 | 0.00% | 0.00% |  |
| B | 163533 | 141143 | 15 | 15 | 0.01% | 0.01% | 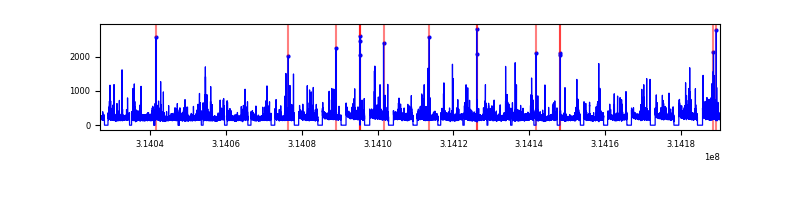 |
| C | 163533 | 141146 | 89 | 89 | 0.05% | 0.06% |  |
| D | 163533 | 141131 | 1188 | 1188 | 0.73% | 0.84% | 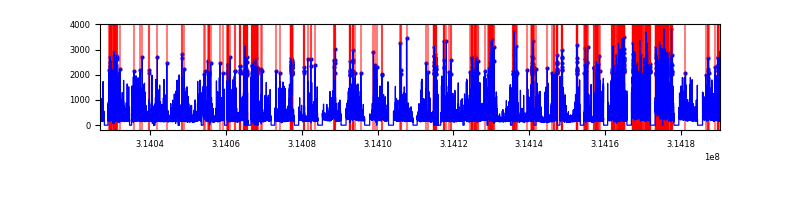 |
Top three noisy pixels from each quadrant. If the there are fewer than three noisy pixels in the level2.evt file, extra rows are filled as -1
| Pixel properties | Quadrant properties | ||||||
|---|---|---|---|---|---|---|---|
| Quadrant | DetID | PixID | Counts | Sigma | Mean | Median | Sigma |
| A | 13 | 254 | 252517 | 143.42 | 7915 | 7814 | 1706.3 |
| A | 10 | 17 | 195125 | 109.78 | 7915 | 7814 | 1706.3 |
| A | 0 | 226 | 51927 | 25.85 | 7915 | 7814 | 1706.3 |
| B | 0 | 230 | 556597 | 371.2 | 7940 | 7792 | 1478.5 |
| B | 0 | 228 | 422652 | 280.6 | 7940 | 7792 | 1478.5 |
| B | 0 | 190 | 278612 | 183.18 | 7940 | 7792 | 1478.5 |
| C | 10 | 22 | 1260768 | 706.31 | 7555 | 7579 | 1774.3 |
| C | 2 | 16 | 117467 | 61.93 | 7555 | 7579 | 1774.3 |
| C | 13 | 61 | 43747 | 20.38 | 7555 | 7579 | 1774.3 |
| D | 1 | 52 | 19140759 | 10698.41 | 7618 | 7387 | 1788.4 |
| D | 12 | 227 | 1023886 | 568.37 | 7618 | 7387 | 1788.4 |
| D | 2 | 152 | 973881 | 540.41 | 7618 | 7387 | 1788.4 |
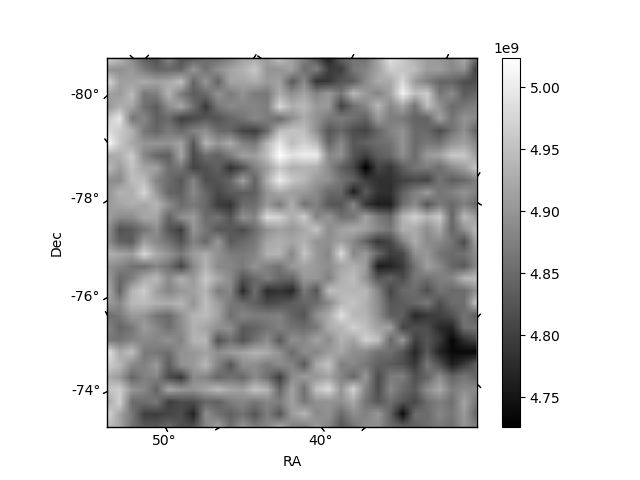
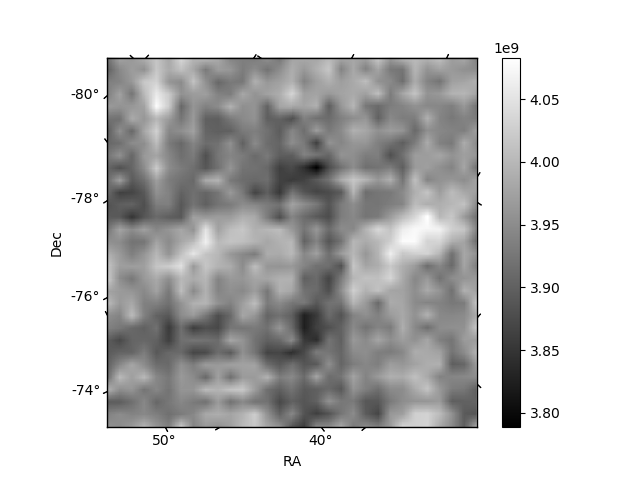
Histogram calculated using DETX and DETY for each event in the final _common_clean file
| Quadrant A | 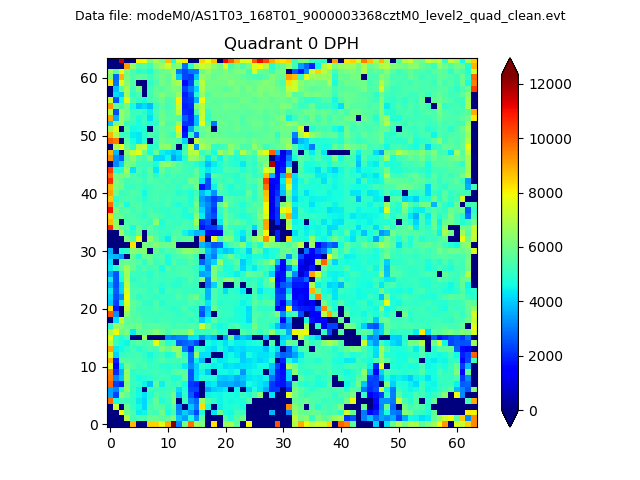 |
 |
Quadrant B |
|---|---|---|---|
| Quadrant D |  |
 |
Quadrant C |
| Plot type | Count rate plots | Images |
|---|---|---|
| Comparison with Poisson distribution Blue bars denote a histogram of data divided into 1 sec bins. Red curve is a Poisson curve with rate = median count rate of data. |
 |
 |
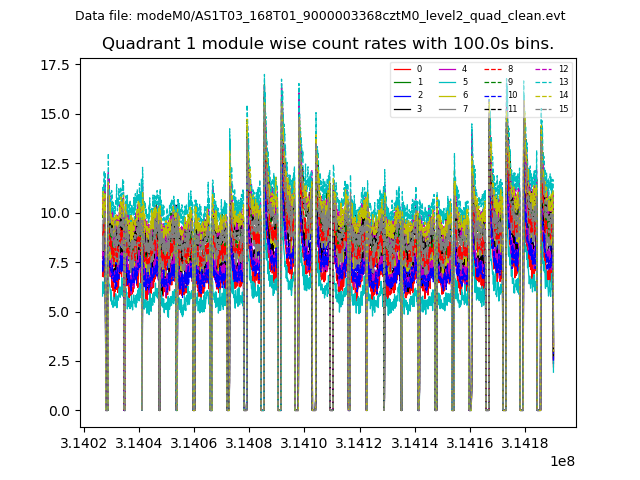
| Quadrant-wise count rates Data is divided into 100 sec bins |
 |
|
| Module-wise count rates for Quadrant A Data is divided into 100 sec bins |
 |
 |
| Module-wise count rates for Quadrant B Data is divided into 100 sec bins |
 |
 |
| Module-wise count rates for Quadrant C Data is divided into 100 sec bins |
 |
 |
| Module-wise count rates for Quadrant D Data is divided into 100 sec bins |
 |
 |
| Parameter | Plot |
|---|---|
| CZT HV Monitor | 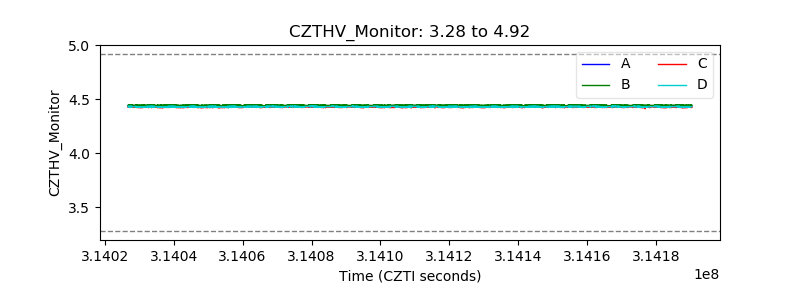 |
| D_VDD |  |
| Temperature 1 | 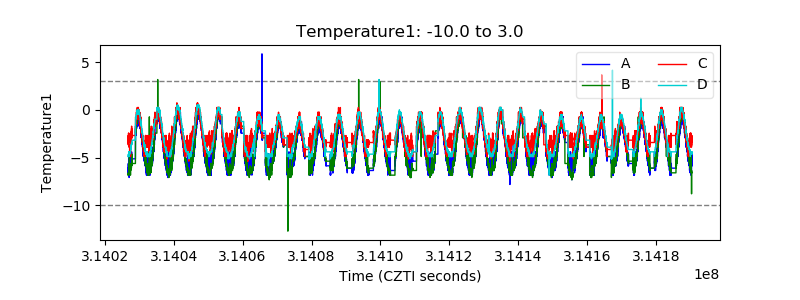 |
| Veto HV Monitor |  |
| Veto LLD |  |
| Alpha Counter |  |
| _CPM_Rate | 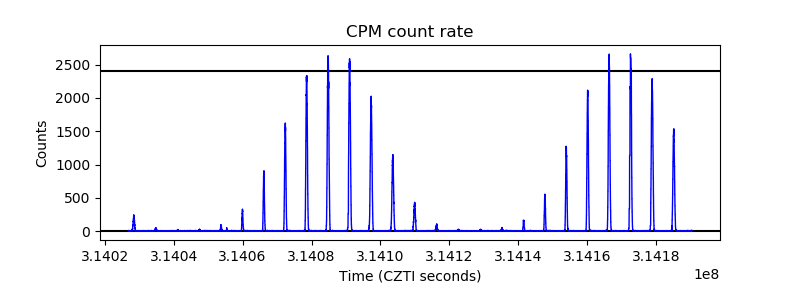 |
| CZT Counter |  |
| +2.5 Volts monitor |  |
| +5 Volts monitor | 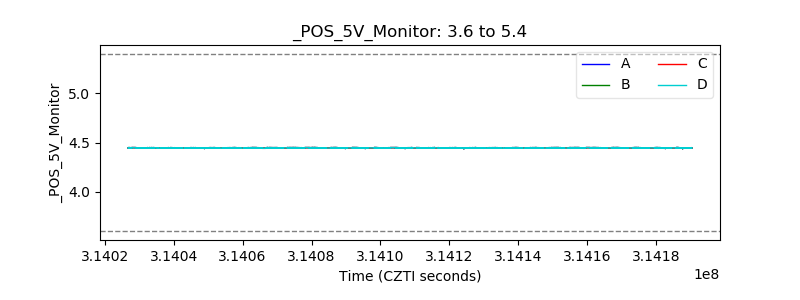 |
| _ROLL_ROT |  |
| _Roll_DEC |  |
| _Roll_RA |  |
| Veto Counter | 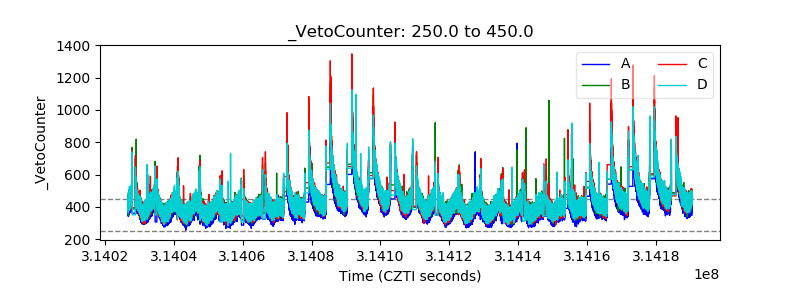 |