| Param | Original file | Final file |
|---|---|---|
| Filename | modeM0/AS1A08_007T01_9000003362cztM0_level2_bc.evt | modeM0/AS1A08_007T01_9000003362cztM0_level2_quad_clean.evt |
| Size (bytes) | 22,115,727,360 | 8,136,164,160 |
| Size | 20.6 GB | 7.6 GB |
| Events in quadrant A | 126,397,315 | 52,993,404 |
| Events in quadrant B | 139,006,996 | 53,395,621 |
| Events in quadrant C | 122,851,921 | 51,146,219 |
| Events in quadrant D | 242,106,857 | 49,240,094 |
| Mode SS | |||
|---|---|---|---|
| Quadrant | BADHDUFLAG | Total packets | Discarded packets |
| A | 0 | 11806 | 0 |
| B | 0 | 11806 | 0 |
| C | 0 | 11806 | 0 |
| D | 0 | 11806 | 0 |
| Mode M0 | |||
|---|---|---|---|
| Quadrant | BADHDUFLAG | Total packets | Discarded packets |
| A | 0 | 1209033 | 0 |
| B | 0 | 1253694 | 0 |
| C | 0 | 1217650 | 0 |
| D | 0 | 1616937 | 0 |
| Mode M9 | |||
|---|---|---|---|
| Quadrant | BADHDUFLAG | Total packets | Discarded packets |
| A | 0 | 949 | 0 |
| B | 0 | 951 | 0 |
| C | 0 | 951 | 0 |
| D | 0 | 950 | 0 |
| Quadrant | Total seconds | Saturated seconds | Saturation percentage |
|---|---|---|---|
| A | 579456 | 5368 | 0.926386% |
| B | 579444 | 7339 | 1.266559% |
| C | 579456 | 8764 | 1.512453% |
| D | 579432 | 32011 | 5.524548% |
Noise dominated data is calculated using 1-second bins in cleaned event files. If a bin has >2000 counts, and if more than 50% of those come from <1% of pixels, then it is considered to be noise-dominated and hence unusable.
| Quadrant | # 1 sec bins | Bins with >0 counts | Bins with >2000 counts | High rate bins dominated by noise | Noise dominated (total time) | Noise dominated (detector-on time) | Marked lightcurve |
|---|---|---|---|---|---|---|---|
| A | 682120 | 579544 | 22 | 22 | 0.00% | 0.00% |  |
| B | 682120 | 579533 | 142 | 142 | 0.02% | 0.02% |  |
| C | 682120 | 579538 | 83 | 83 | 0.01% | 0.01% |  |
| D | 682120 | 579498 | 6421 | 6421 | 0.94% | 1.11% |  |
Top three noisy pixels from each quadrant. If the there are fewer than three noisy pixels in the level2.evt file, extra rows are filled as -1
| Pixel properties | Quadrant properties | ||||||
|---|---|---|---|---|---|---|---|
| Quadrant | DetID | PixID | Counts | Sigma | Mean | Median | Sigma |
| A | 13 | 254 | 985404 | 137.06 | 32341 | 31812 | 6957.3 |
| A | 11 | 47 | 421582 | 56.02 | 32341 | 31812 | 6957.3 |
| A | 10 | 17 | 306597 | 39.5 | 32341 | 31812 | 6957.3 |
| B | 0 | 190 | 2289597 | 376.66 | 32365 | 31710 | 5994.6 |
| B | 0 | 219 | 2279205 | 374.92 | 32365 | 31710 | 5994.6 |
| B | 0 | 230 | 2061694 | 338.64 | 32365 | 31710 | 5994.6 |
| C | 10 | 22 | 2024489 | 274.16 | 30978 | 30960 | 7271.4 |
| C | 9 | 54 | 403708 | 51.26 | 30978 | 30960 | 7271.4 |
| C | 10 | 23 | 308330 | 38.15 | 30978 | 30960 | 7271.4 |
| D | 1 | 52 | 49378045 | 6769.4 | 31298 | 30317 | 7289.8 |
| D | 7 | 238 | 21847097 | 2992.77 | 31298 | 30317 | 7289.8 |
| D | 12 | 227 | 11777945 | 1611.51 | 31298 | 30317 | 7289.8 |
Histogram calculated using DETX and DETY for each event in the final _common_clean file
| Quadrant A | 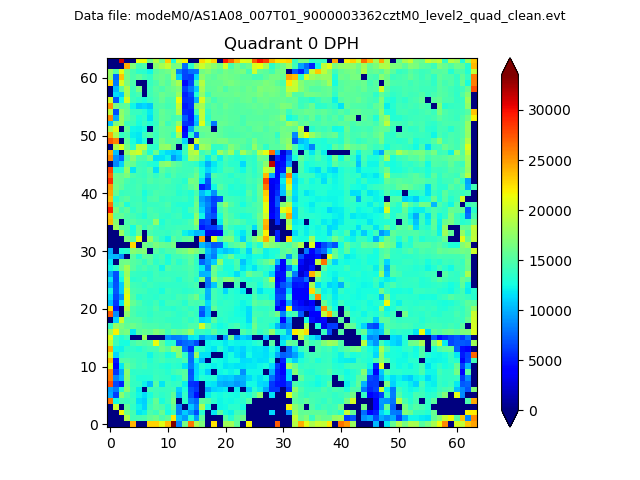 |
 |
Quadrant B |
|---|---|---|---|
| Quadrant D |  |
 |
Quadrant C |
| Plot type | Count rate plots | Images |
|---|---|---|
| Comparison with Poisson distribution Blue bars denote a histogram of data divided into 1 sec bins. Red curve is a Poisson curve with rate = median count rate of data. |
 |
 |
| Quadrant-wise count rates Data is divided into 100 sec bins |
 |
|
| Module-wise count rates for Quadrant A Data is divided into 100 sec bins |
 |
 |
| Module-wise count rates for Quadrant B Data is divided into 100 sec bins |
 |
 |
| Module-wise count rates for Quadrant C Data is divided into 100 sec bins |
 |
 |
| Module-wise count rates for Quadrant D Data is divided into 100 sec bins |
 |
 |
| Parameter | Plot |
|---|---|
| CZT HV Monitor |  |
| D_VDD | 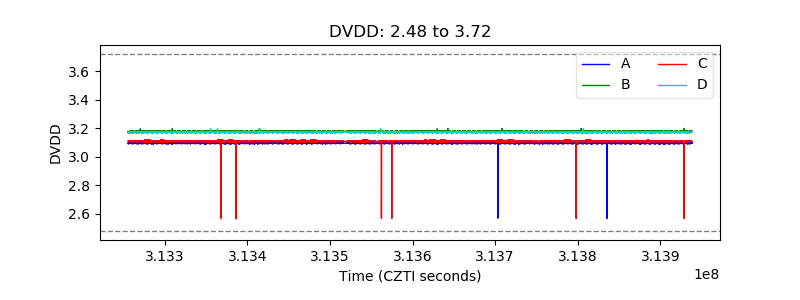 |
| Temperature 1 |  |
| Veto HV Monitor |  |
| Veto LLD | 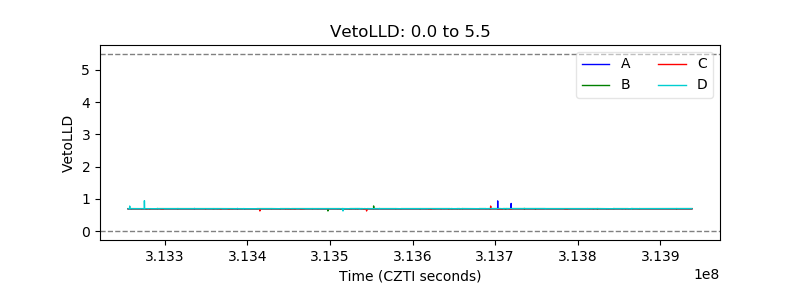 |
| Alpha Counter |  |
| _CPM_Rate |  |
| CZT Counter |  |
| +2.5 Volts monitor |  |
| +5 Volts monitor | 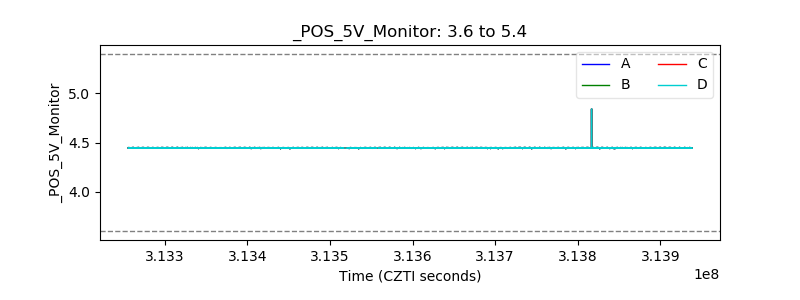 |
| _ROLL_ROT |  |
| _Roll_DEC |  |
| _Roll_RA |  |
| Veto Counter |  |