| Param | Original file | Final file |
|---|---|---|
| Filename | modeM0/AS1A07_112T01_9000003360cztM0_level2_bc.evt | modeM0/AS1A07_112T01_9000003360cztM0_level2_quad_clean.evt |
| Size (bytes) | 3,364,292,160 | 1,152,380,160 |
| Size | 3.1 GB | 1.1 GB |
| Events in quadrant A | 19,528,640 | 7,340,843 |
| Events in quadrant B | 20,286,921 | 7,448,404 |
| Events in quadrant C | 19,239,255 | 7,187,655 |
| Events in quadrant D | 36,740,957 | 6,798,535 |
| Mode M9 | |||
|---|---|---|---|
| Quadrant | BADHDUFLAG | Total packets | Discarded packets |
| A | 0 | 165 | 0 |
| B | 0 | 165 | 0 |
| C | 0 | 165 | 0 |
| D | 0 | 165 | 0 |
| Mode M0 | |||
|---|---|---|---|
| Quadrant | BADHDUFLAG | Total packets | Discarded packets |
| A | 0 | 187849 | 0 |
| B | 0 | 191152 | 0 |
| C | 0 | 190042 | 0 |
| D | 0 | 262825 | 0 |
| Mode SS | |||
|---|---|---|---|
| Quadrant | BADHDUFLAG | Total packets | Discarded packets |
| A | 0 | 1820 | 0 |
| B | 0 | 1820 | 0 |
| C | 0 | 1820 | 0 |
| D | 0 | 1820 | 0 |
| Quadrant | Total seconds | Saturated seconds | Saturation percentage |
|---|---|---|---|
| A | 89421 | 996 | 1.113832% |
| B | 89421 | 1228 | 1.373279% |
| C | 89421 | 1634 | 1.827311% |
| D | 89421 | 7765 | 8.683643% |
Noise dominated data is calculated using 1-second bins in cleaned event files. If a bin has >2000 counts, and if more than 50% of those come from <1% of pixels, then it is considered to be noise-dominated and hence unusable.
| Quadrant | # 1 sec bins | Bins with >0 counts | Bins with >2000 counts | High rate bins dominated by noise | Noise dominated (total time) | Noise dominated (detector-on time) | Marked lightcurve |
|---|---|---|---|---|---|---|---|
| A | 105616 | 89425 | 0 | 0 | 0.00% | 0.00% |  |
| B | 105616 | 89423 | 4 | 4 | 0.00% | 0.00% |  |
| C | 105616 | 89424 | 14 | 14 | 0.01% | 0.02% |  |
| D | 105616 | 89424 | 681 | 681 | 0.64% | 0.76% |  |
Top three noisy pixels from each quadrant. If the there are fewer than three noisy pixels in the level2.evt file, extra rows are filled as -1
| Pixel properties | Quadrant properties | ||||||
|---|---|---|---|---|---|---|---|
| Quadrant | DetID | PixID | Counts | Sigma | Mean | Median | Sigma |
| A | 13 | 254 | 135007 | 120.66 | 5028 | 4945 | 1077.9 |
| A | 11 | 47 | 131848 | 117.73 | 5028 | 4945 | 1077.9 |
| A | 0 | 226 | 32371 | 25.44 | 5028 | 4945 | 1077.9 |
| B | 0 | 190 | 245038 | 257.16 | 5051 | 4942 | 933.6 |
| B | 0 | 197 | 167808 | 174.44 | 5051 | 4942 | 933.6 |
| B | 0 | 230 | 142503 | 147.34 | 5051 | 4942 | 933.6 |
| C | 10 | 22 | 200565 | 173.37 | 4861 | 4852 | 1128.8 |
| C | 0 | 10 | 200290 | 173.13 | 4861 | 4852 | 1128.8 |
| C | 0 | 207 | 73284 | 60.62 | 4861 | 4852 | 1128.8 |
| D | 1 | 52 | 8108279 | 7378.36 | 4777 | 4626 | 1098.3 |
| D | 1 | 239 | 4800152 | 4366.32 | 4777 | 4626 | 1098.3 |
| D | 12 | 227 | 2791949 | 2537.85 | 4777 | 4626 | 1098.3 |
Histogram calculated using DETX and DETY for each event in the final _common_clean file
| Quadrant A |  |
 |
Quadrant B |
|---|---|---|---|
| Quadrant D |  |
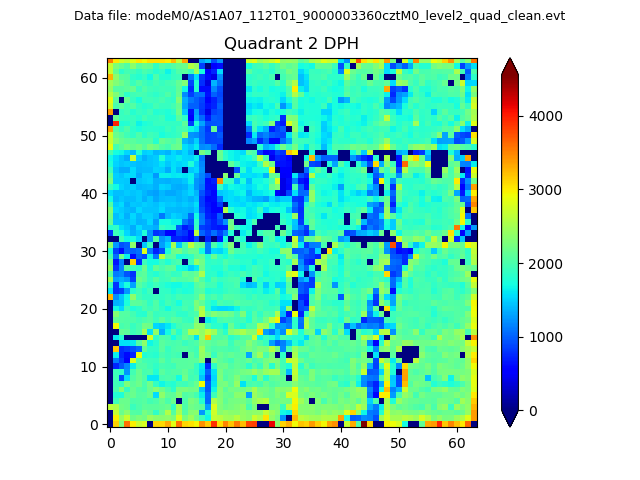 |
Quadrant C |
| Plot type | Count rate plots | Images |
|---|---|---|
| Comparison with Poisson distribution Blue bars denote a histogram of data divided into 1 sec bins. Red curve is a Poisson curve with rate = median count rate of data. |
 |
 |
| Quadrant-wise count rates Data is divided into 100 sec bins |
 |
|
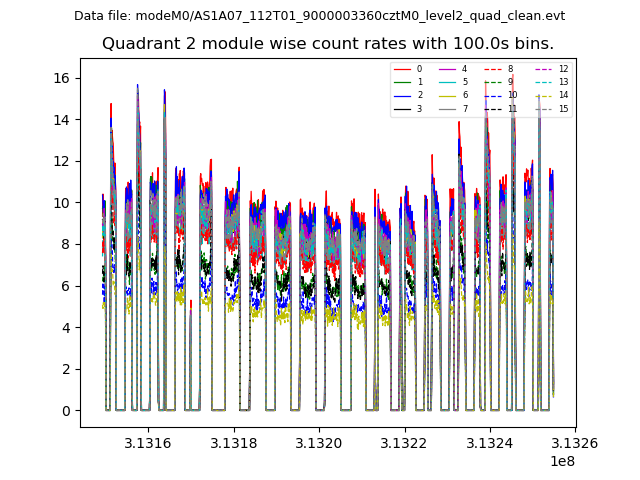
| Module-wise count rates for Quadrant A Data is divided into 100 sec bins |
 |
 |
| Module-wise count rates for Quadrant B Data is divided into 100 sec bins |
 |
 |
| Module-wise count rates for Quadrant C Data is divided into 100 sec bins |
 |
 |
| Module-wise count rates for Quadrant D Data is divided into 100 sec bins |
 |
 |
| Parameter | Plot |
|---|---|
| CZT HV Monitor |  |
| D_VDD | 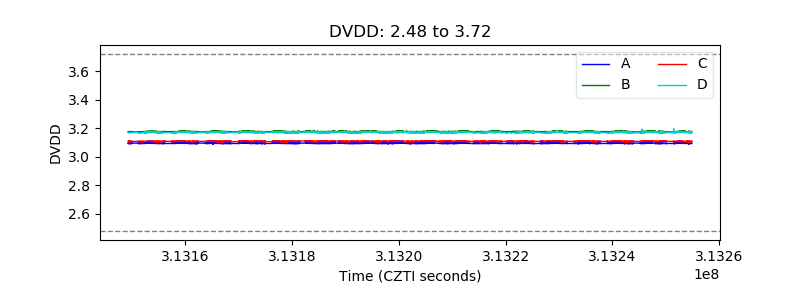 |
| Temperature 1 |  |
| Veto HV Monitor |  |
| Veto LLD |  |
| Alpha Counter |  |
| _CPM_Rate |  |
| CZT Counter |  |
| +2.5 Volts monitor |  |
| +5 Volts monitor |  |
| _ROLL_ROT |  |
| _Roll_DEC | 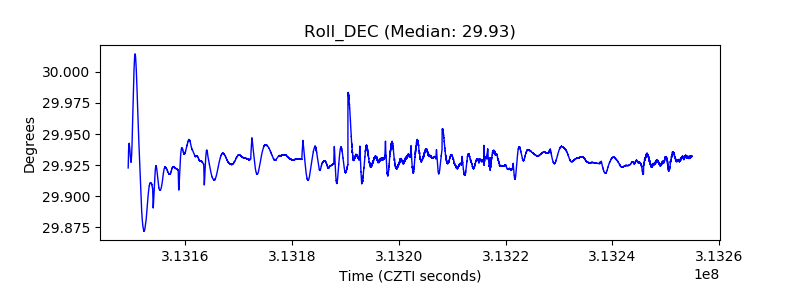 |
| _Roll_RA |  |
| Veto Counter |  |