| Param | Original file | Final file |
|---|---|---|
| Filename | modeM0/AS1C05_006T01_9000003356cztM0_level2_bc.evt | modeM0/AS1C05_006T01_9000003356cztM0_level2_quad_clean.evt |
| Size (bytes) | 1,384,571,520 | 589,360,320 |
| Size | 1.3 GB | 562.1 MB |
| Events in quadrant A | 9,596,512 | 3,765,060 |
| Events in quadrant B | 9,627,028 | 3,810,579 |
| Events in quadrant C | 8,807,306 | 3,633,988 |
| Events in quadrant D | 10,859,233 | 3,584,226 |
| Mode SS | |||
|---|---|---|---|
| Quadrant | BADHDUFLAG | Total packets | Discarded packets |
| A | 0 | 906 | 0 |
| B | 0 | 906 | 0 |
| C | 0 | 906 | 0 |
| D | 0 | 906 | 0 |
| Mode M0 | |||
|---|---|---|---|
| Quadrant | BADHDUFLAG | Total packets | Discarded packets |
| A | 0 | 93980 | 0 |
| B | 0 | 94125 | 0 |
| C | 0 | 91890 | 0 |
| D | 0 | 96219 | 0 |
| Mode M9 | |||
|---|---|---|---|
| Quadrant | BADHDUFLAG | Total packets | Discarded packets |
| A | 0 | 52 | 0 |
| B | 0 | 52 | 0 |
| C | 0 | 52 | 0 |
| D | 0 | 52 | 0 |
| Quadrant | Total seconds | Saturated seconds | Saturation percentage |
|---|---|---|---|
| A | 44552 | 627 | 1.407344% |
| B | 44552 | 637 | 1.429790% |
| C | 44552 | 665 | 1.492638% |
| D | 44552 | 341 | 0.765398% |
Noise dominated data is calculated using 1-second bins in cleaned event files. If a bin has >2000 counts, and if more than 50% of those come from <1% of pixels, then it is considered to be noise-dominated and hence unusable.
| Quadrant | # 1 sec bins | Bins with >0 counts | Bins with >2000 counts | High rate bins dominated by noise | Noise dominated (total time) | Noise dominated (detector-on time) | Marked lightcurve |
|---|---|---|---|---|---|---|---|
| A | 49687 | 44555 | 3 | 3 | 0.01% | 0.01% |  |
| B | 49687 | 44554 | 2 | 2 | 0.00% | 0.00% |  |
| C | 49687 | 44553 | 6 | 6 | 0.01% | 0.01% |  |
| D | 49687 | 44553 | 14 | 14 | 0.03% | 0.03% | 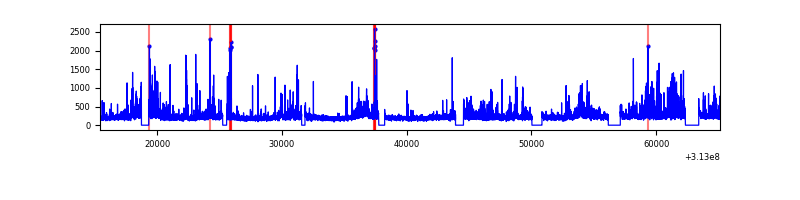 |
Top three noisy pixels from each quadrant. If the there are fewer than three noisy pixels in the level2.evt file, extra rows are filled as -1
| Pixel properties | Quadrant properties | ||||||
|---|---|---|---|---|---|---|---|
| Quadrant | DetID | PixID | Counts | Sigma | Mean | Median | Sigma |
| A | 14 | 238 | 523457 | 1040.75 | 2283 | 2237 | 500.8 |
| A | 14 | 235 | 239900 | 474.56 | 2283 | 2237 | 500.8 |
| A | 13 | 254 | 70713 | 136.73 | 2283 | 2237 | 500.8 |
| B | 0 | 229 | 277058 | 618.87 | 2303 | 2243 | 444.1 |
| B | 0 | 197 | 150711 | 334.34 | 2303 | 2243 | 444.1 |
| B | 0 | 245 | 107988 | 238.13 | 2303 | 2243 | 444.1 |
| C | 10 | 222 | 193782 | 372.53 | 2194 | 2179 | 514.3 |
| C | 10 | 22 | 127889 | 244.42 | 2194 | 2179 | 514.3 |
| C | 8 | 128 | 13176 | 21.38 | 2194 | 2179 | 514.3 |
| D | 1 | 52 | 869031 | 1646.38 | 2259 | 2173 | 526.5 |
| D | 12 | 227 | 670907 | 1270.1 | 2259 | 2173 | 526.5 |
| D | 1 | 239 | 327466 | 617.81 | 2259 | 2173 | 526.5 |
Histogram calculated using DETX and DETY for each event in the final _common_clean file
| Quadrant A |  |
 |
Quadrant B |
|---|---|---|---|
| Quadrant D |  |
 |
Quadrant C |
| Plot type | Count rate plots | Images |
|---|---|---|
| Comparison with Poisson distribution Blue bars denote a histogram of data divided into 1 sec bins. Red curve is a Poisson curve with rate = median count rate of data. |
 |
 |
| Quadrant-wise count rates Data is divided into 100 sec bins |
 |
|
| Module-wise count rates for Quadrant A Data is divided into 100 sec bins |
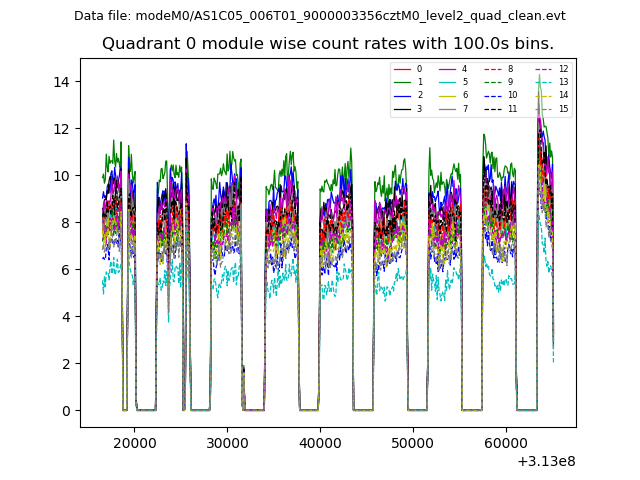 |
 |
| Module-wise count rates for Quadrant B Data is divided into 100 sec bins |
 |
 |
| Module-wise count rates for Quadrant C Data is divided into 100 sec bins |
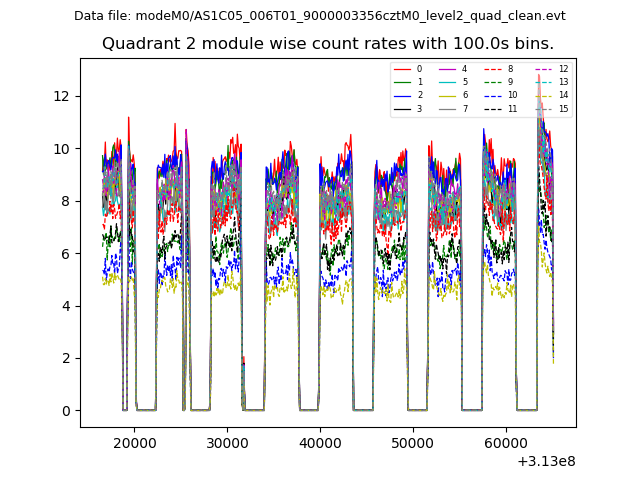 |
 |
| Module-wise count rates for Quadrant D Data is divided into 100 sec bins |
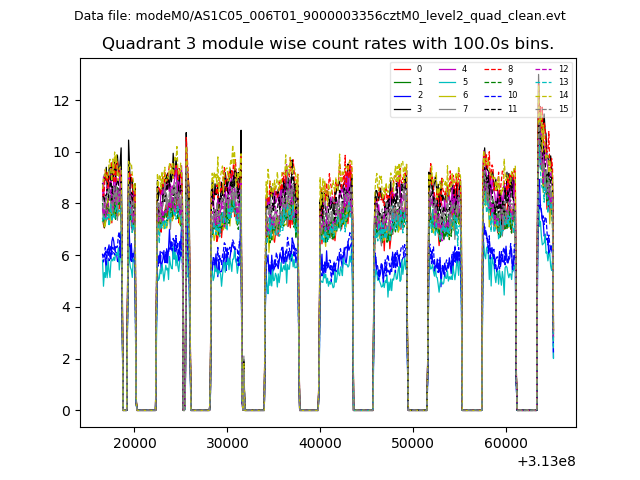 |
 |
| Parameter | Plot |
|---|---|
| CZT HV Monitor |  |
| D_VDD |  |
| Temperature 1 |  |
| Veto HV Monitor |  |
| Veto LLD |  |
| Alpha Counter |  |
| _CPM_Rate |  |
| CZT Counter |  |
| +2.5 Volts monitor |  |
| +5 Volts monitor | 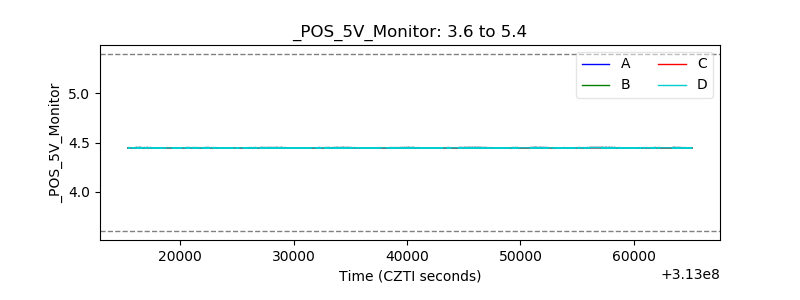 |
| _ROLL_ROT | 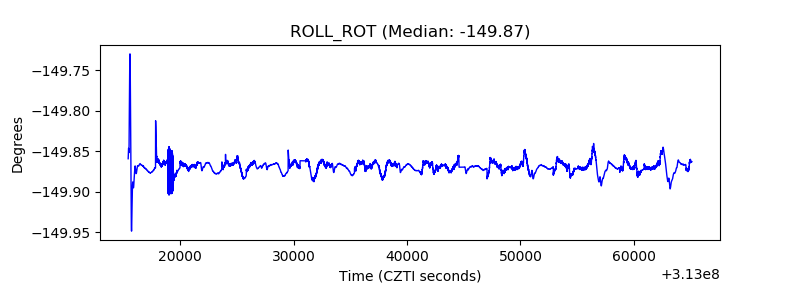 |
| _Roll_DEC |  |
| _Roll_RA |  |
| Veto Counter |  |