| Param | Original file | Final file |
|---|---|---|
| Filename | modeM0/AS1C05_001T01_9000003354cztM0_level2_bc.evt | modeM0/AS1C05_001T01_9000003354cztM0_level2_quad_clean.evt |
| Size (bytes) | 1,969,125,120 | 1,067,872,320 |
| Size | 1.8 GB | 1018.4 MB |
| Events in quadrant A | 11,575,718 | 7,369,976 |
| Events in quadrant B | 13,883,116 | 7,405,256 |
| Events in quadrant C | 11,815,301 | 7,022,200 |
| Events in quadrant D | 18,691,211 | 6,858,389 |
| Mode M9 | |||
|---|---|---|---|
| Quadrant | BADHDUFLAG | Total packets | Discarded packets |
| A | 0 | 108 | 0 |
| B | 0 | 108 | 0 |
| C | 0 | 108 | 0 |
| D | 0 | 108 | 0 |
| Mode SS | |||
|---|---|---|---|
| Quadrant | BADHDUFLAG | Total packets | Discarded packets |
| A | 0 | 1100 | 0 |
| B | 0 | 1100 | 0 |
| C | 0 | 1100 | 0 |
| D | 0 | 1100 | 0 |
| Mode M0 | |||
|---|---|---|---|
| Quadrant | BADHDUFLAG | Total packets | Discarded packets |
| A | 0 | 112055 | 0 |
| B | 0 | 122230 | 0 |
| C | 0 | 113423 | 0 |
| D | 0 | 133344 | 0 |
| Quadrant | Total seconds | Saturated seconds | Saturation percentage |
|---|---|---|---|
| A | 53827 | 553 | 1.027365% |
| B | 53827 | 1056 | 1.961841% |
| C | 53827 | 842 | 1.564271% |
| D | 53827 | 1656 | 3.076523% |
Noise dominated data is calculated using 1-second bins in cleaned event files. If a bin has >2000 counts, and if more than 50% of those come from <1% of pixels, then it is considered to be noise-dominated and hence unusable.
| Quadrant | # 1 sec bins | Bins with >0 counts | Bins with >2000 counts | High rate bins dominated by noise | Noise dominated (total time) | Noise dominated (detector-on time) | Marked lightcurve |
|---|---|---|---|---|---|---|---|
| A | 64698 | 53829 | 0 | 0 | 0.00% | 0.00% |  |
| B | 64698 | 53827 | 14 | 14 | 0.02% | 0.03% |  |
| C | 64698 | 53828 | 1 | 1 | 0.00% | 0.00% |  |
| D | 64698 | 53828 | 454 | 454 | 0.70% | 0.84% |  |
Top three noisy pixels from each quadrant. If the there are fewer than three noisy pixels in the level2.evt file, extra rows are filled as -1
| Pixel properties | Quadrant properties | ||||||
|---|---|---|---|---|---|---|---|
| Quadrant | DetID | PixID | Counts | Sigma | Mean | Median | Sigma |
| A | 13 | 254 | 88234 | 130.86 | 2969 | 2928 | 651.9 |
| A | 11 | 47 | 87207 | 129.29 | 2969 | 2928 | 651.9 |
| A | 0 | 226 | 19524 | 25.46 | 2969 | 2928 | 651.9 |
| B | 15 | 33 | 1028772 | 1851.88 | 2967 | 2905 | 554.0 |
| B | 15 | 35 | 321561 | 575.23 | 2967 | 2905 | 554.0 |
| B | 0 | 190 | 288847 | 516.18 | 2967 | 2905 | 554.0 |
| C | 10 | 222 | 825980 | 1248.13 | 2806 | 2801 | 659.5 |
| C | 10 | 22 | 104359 | 153.99 | 2806 | 2801 | 659.5 |
| C | 0 | 10 | 33877 | 47.12 | 2806 | 2801 | 659.5 |
| D | 1 | 52 | 4896949 | 7217.75 | 2868 | 2773 | 678.1 |
| D | 12 | 227 | 955093 | 1404.45 | 2868 | 2773 | 678.1 |
| D | 12 | 233 | 713614 | 1048.32 | 2868 | 2773 | 678.1 |
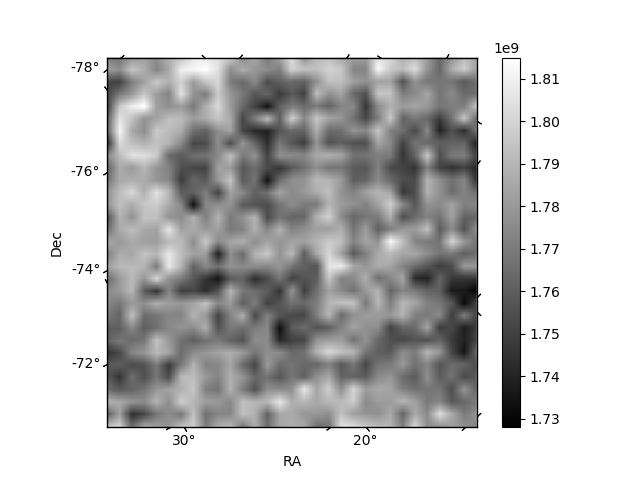
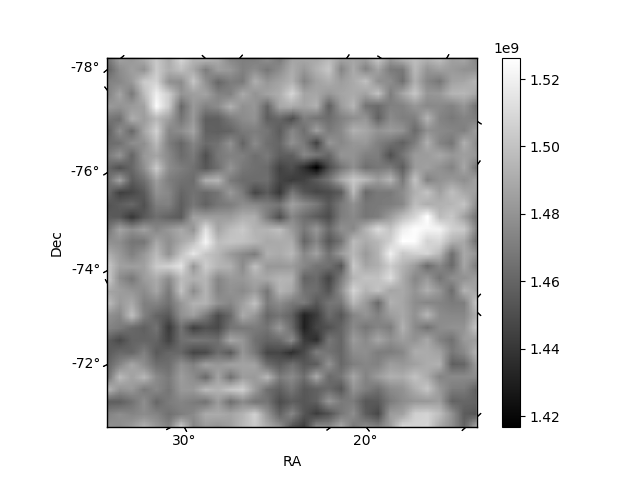
Histogram calculated using DETX and DETY for each event in the final _common_clean file
| Quadrant A |  |
 |
Quadrant B |
|---|---|---|---|
| Quadrant D |  |
 |
Quadrant C |
| Plot type | Count rate plots | Images |
|---|---|---|
| Comparison with Poisson distribution Blue bars denote a histogram of data divided into 1 sec bins. Red curve is a Poisson curve with rate = median count rate of data. |
 |
 |
| Quadrant-wise count rates Data is divided into 100 sec bins |
 |
|
| Module-wise count rates for Quadrant A Data is divided into 100 sec bins |
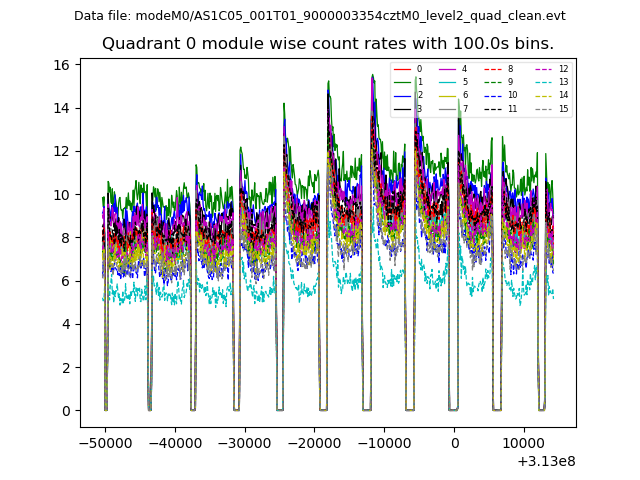 |
 |
| Module-wise count rates for Quadrant B Data is divided into 100 sec bins |
 |
 |
| Module-wise count rates for Quadrant C Data is divided into 100 sec bins |
 |
 |
| Module-wise count rates for Quadrant D Data is divided into 100 sec bins |
 |
 |
| Parameter | Plot |
|---|---|
| CZT HV Monitor |  |
| D_VDD |  |
| Temperature 1 |  |
| Veto HV Monitor |  |
| Veto LLD |  |
| Alpha Counter | 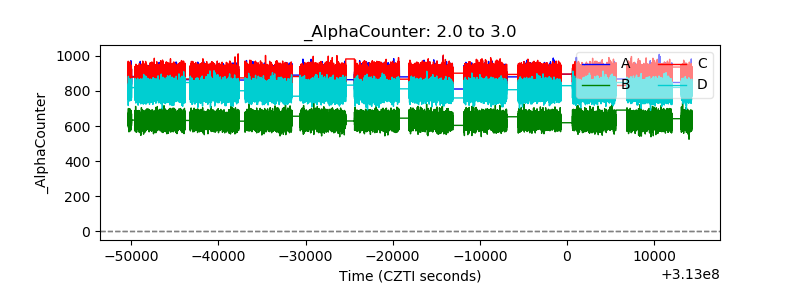 |
| _CPM_Rate | 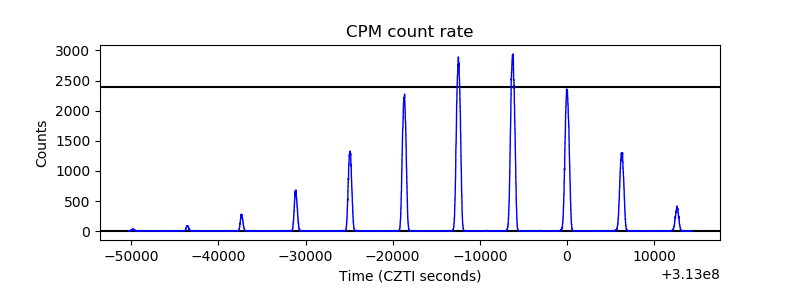 |
| CZT Counter |  |
| +2.5 Volts monitor |  |
| +5 Volts monitor |  |
| _ROLL_ROT |  |
| _Roll_DEC |  |
| _Roll_RA |  |
| Veto Counter | 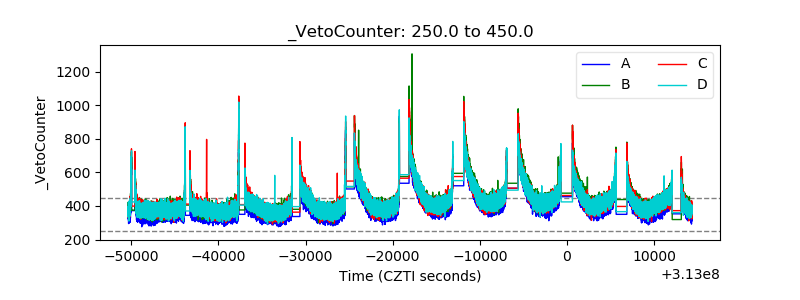 |