| Param | Original file | Final file |
|---|---|---|
| Filename | modeM0/AS1A07_054T01_9000003348cztM0_level2_bc.evt | modeM0/AS1A07_054T01_9000003348cztM0_level2_quad_clean.evt |
| Size (bytes) | 2,274,615,360 | 1,191,585,600 |
| Size | 2.1 GB | 1.1 GB |
| Events in quadrant A | 15,751,208 | 7,967,481 |
| Events in quadrant B | 15,616,481 | 7,985,214 |
| Events in quadrant C | 14,547,312 | 7,734,321 |
| Events in quadrant D | 18,230,247 | 7,640,374 |
| Mode M9 | |||
|---|---|---|---|
| Quadrant | BADHDUFLAG | Total packets | Discarded packets |
| A | 0 | 111 | 0 |
| B | 0 | 111 | 0 |
| C | 0 | 111 | 0 |
| D | 0 | 111 | 0 |
| Mode SS | |||
|---|---|---|---|
| Quadrant | BADHDUFLAG | Total packets | Discarded packets |
| A | 0 | 1420 | 0 |
| B | 0 | 1420 | 0 |
| C | 0 | 1420 | 0 |
| D | 0 | 1420 | 0 |
| Mode M0 | |||
|---|---|---|---|
| Quadrant | BADHDUFLAG | Total packets | Discarded packets |
| A | 0 | 147025 | 0 |
| B | 0 | 149655 | 0 |
| C | 0 | 145849 | 0 |
| D | 0 | 154672 | 0 |
| Quadrant | Total seconds | Saturated seconds | Saturation percentage |
|---|---|---|---|
| A | 69532 | 602 | 0.865788% |
| B | 69532 | 1025 | 1.474141% |
| C | 69532 | 953 | 1.370592% |
| D | 69532 | 982 | 1.412299% |
Noise dominated data is calculated using 1-second bins in cleaned event files. If a bin has >2000 counts, and if more than 50% of those come from <1% of pixels, then it is considered to be noise-dominated and hence unusable.
| Quadrant | # 1 sec bins | Bins with >0 counts | Bins with >2000 counts | High rate bins dominated by noise | Noise dominated (total time) | Noise dominated (detector-on time) | Marked lightcurve |
|---|---|---|---|---|---|---|---|
| A | 80837 | 69535 | 0 | 0 | 0.00% | 0.00% |  |
| B | 80837 | 69534 | 1 | 1 | 0.00% | 0.00% | 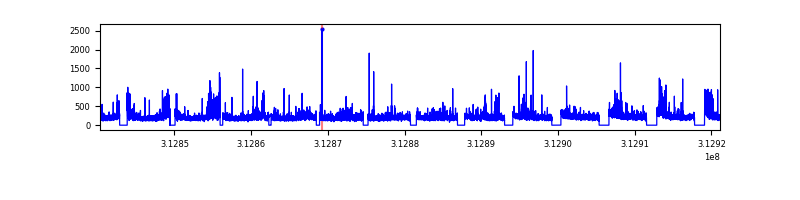 |
| C | 80837 | 69533 | 0 | 0 | 0.00% | 0.00% |  |
| D | 80837 | 69534 | 191 | 191 | 0.24% | 0.27% | 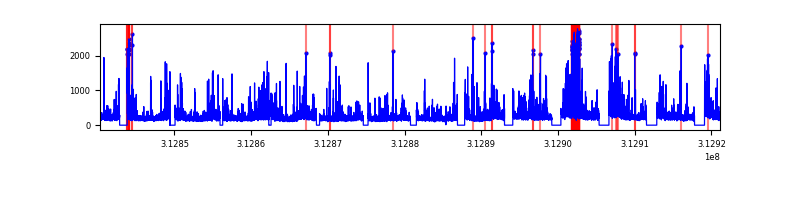 |
Top three noisy pixels from each quadrant. If the there are fewer than three noisy pixels in the level2.evt file, extra rows are filled as -1
| Pixel properties | Quadrant properties | ||||||
|---|---|---|---|---|---|---|---|
| Quadrant | DetID | PixID | Counts | Sigma | Mean | Median | Sigma |
| A | 13 | 34 | 1191191 | 1464.89 | 3760 | 3701 | 810.6 |
| A | 13 | 254 | 110548 | 131.81 | 3760 | 3701 | 810.6 |
| A | 0 | 226 | 24217 | 25.31 | 3760 | 3701 | 810.6 |
| B | 15 | 33 | 588112 | 835.98 | 3757 | 3673 | 699.1 |
| B | 0 | 190 | 114270 | 158.2 | 3757 | 3673 | 699.1 |
| B | 0 | 230 | 103057 | 142.16 | 3757 | 3673 | 699.1 |
| C | 10 | 222 | 399237 | 461.63 | 3632 | 3624 | 857.0 |
| C | 10 | 22 | 86164 | 96.31 | 3632 | 3624 | 857.0 |
| C | 0 | 10 | 35396 | 37.07 | 3632 | 3624 | 857.0 |
| D | 1 | 52 | 2448747 | 2787.19 | 3730 | 3608 | 877.3 |
| D | 12 | 33 | 353872 | 399.26 | 3730 | 3608 | 877.3 |
| D | 2 | 234 | 290041 | 326.5 | 3730 | 3608 | 877.3 |
Histogram calculated using DETX and DETY for each event in the final _common_clean file
| Quadrant A |  |
 |
Quadrant B |
|---|---|---|---|
| Quadrant D |  |
 |
Quadrant C |
| Plot type | Count rate plots | Images |
|---|---|---|
| Comparison with Poisson distribution Blue bars denote a histogram of data divided into 1 sec bins. Red curve is a Poisson curve with rate = median count rate of data. |
 |
 |
| Quadrant-wise count rates Data is divided into 100 sec bins |
 |
|
| Module-wise count rates for Quadrant A Data is divided into 100 sec bins |
 |
 |
| Module-wise count rates for Quadrant B Data is divided into 100 sec bins |
 |
 |
| Module-wise count rates for Quadrant C Data is divided into 100 sec bins |
 |
 |
| Module-wise count rates for Quadrant D Data is divided into 100 sec bins |
 |
 |
| Parameter | Plot |
|---|---|
| CZT HV Monitor |  |
| D_VDD |  |
| Temperature 1 |  |
| Veto HV Monitor |  |
| Veto LLD |  |
| Alpha Counter |  |
| _CPM_Rate |  |
| CZT Counter |  |
| +2.5 Volts monitor |  |
| +5 Volts monitor |  |
| _ROLL_ROT |  |
| _Roll_DEC |  |
| _Roll_RA |  |
| Veto Counter |  |