| Param | Original file | Final file |
|---|---|---|
| Filename | modeM0/AS1A07_049T01_9000003344cztM0_level2_bc.evt | modeM0/AS1A07_049T01_9000003344cztM0_level2_quad_clean.evt |
| Size (bytes) | 2,269,180,800 | 825,528,960 |
| Size | 2.1 GB | 787.3 MB |
| Events in quadrant A | 13,017,182 | 5,314,742 |
| Events in quadrant B | 14,078,461 | 5,377,568 |
| Events in quadrant C | 12,757,054 | 5,122,250 |
| Events in quadrant D | 24,558,277 | 4,855,150 |
| Mode M0 | |||
|---|---|---|---|
| Quadrant | BADHDUFLAG | Total packets | Discarded packets |
| A | 0 | 130386 | 0 |
| B | 0 | 135103 | 0 |
| C | 0 | 130882 | 0 |
| D | 0 | 185077 | 0 |
| Mode M9 | |||
|---|---|---|---|
| Quadrant | BADHDUFLAG | Total packets | Discarded packets |
| A | 0 | 105 | 0 |
| B | 0 | 105 | 0 |
| C | 0 | 105 | 0 |
| D | 0 | 105 | 0 |
| Mode SS | |||
|---|---|---|---|
| Quadrant | BADHDUFLAG | Total packets | Discarded packets |
| A | 0 | 1286 | 0 |
| B | 0 | 1286 | 0 |
| C | 0 | 1286 | 0 |
| D | 0 | 1286 | 0 |
| Quadrant | Total seconds | Saturated seconds | Saturation percentage |
|---|---|---|---|
| A | 63204 | 521 | 0.824315% |
| B | 63204 | 902 | 1.427125% |
| C | 63204 | 831 | 1.314790% |
| D | 63204 | 6043 | 9.561104% |
Noise dominated data is calculated using 1-second bins in cleaned event files. If a bin has >2000 counts, and if more than 50% of those come from <1% of pixels, then it is considered to be noise-dominated and hence unusable.
| Quadrant | # 1 sec bins | Bins with >0 counts | Bins with >2000 counts | High rate bins dominated by noise | Noise dominated (total time) | Noise dominated (detector-on time) | Marked lightcurve |
|---|---|---|---|---|---|---|---|
| A | 73744 | 63196 | 0 | 0 | 0.00% | 0.00% | 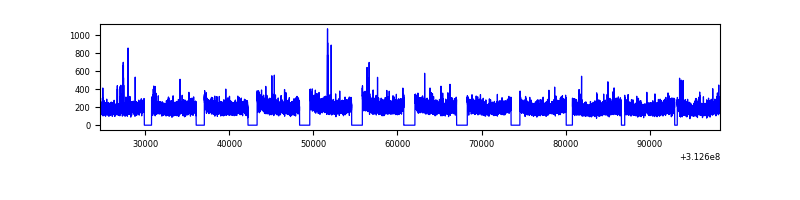 |
| B | 73744 | 63195 | 12 | 12 | 0.02% | 0.02% | 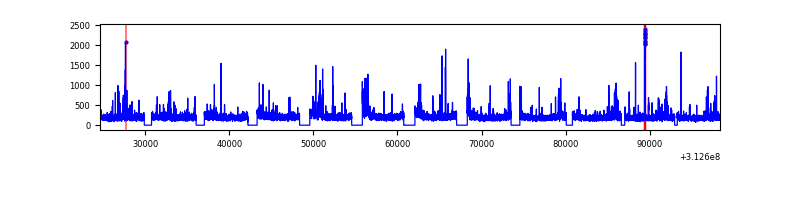 |
| C | 73744 | 63196 | 1 | 1 | 0.00% | 0.00% |  |
| D | 73744 | 63192 | 916 | 916 | 1.24% | 1.45% |  |
Top three noisy pixels from each quadrant. If the there are fewer than three noisy pixels in the level2.evt file, extra rows are filled as -1
| Pixel properties | Quadrant properties | ||||||
|---|---|---|---|---|---|---|---|
| Quadrant | DetID | PixID | Counts | Sigma | Mean | Median | Sigma |
| A | 13 | 254 | 95458 | 126.56 | 3361 | 3299 | 728.2 |
| A | 3 | 1 | 40191 | 50.66 | 3361 | 3299 | 728.2 |
| A | 0 | 226 | 21925 | 25.58 | 3361 | 3299 | 728.2 |
| B | 15 | 33 | 613378 | 961.79 | 3391 | 3309 | 634.3 |
| B | 5 | 172 | 147632 | 227.53 | 3391 | 3309 | 634.3 |
| B | 0 | 229 | 87490 | 132.71 | 3391 | 3309 | 634.3 |
| C | 0 | 207 | 126343 | 161.94 | 3241 | 3228 | 760.3 |
| C | 10 | 22 | 79669 | 100.54 | 3241 | 3228 | 760.3 |
| C | 0 | 10 | 45705 | 55.87 | 3241 | 3228 | 760.3 |
| D | 1 | 52 | 6069782 | 8411.37 | 3108 | 2999 | 721.3 |
| D | 7 | 223 | 5091188 | 7054.58 | 3108 | 2999 | 721.3 |
| D | 12 | 227 | 613412 | 846.31 | 3108 | 2999 | 721.3 |
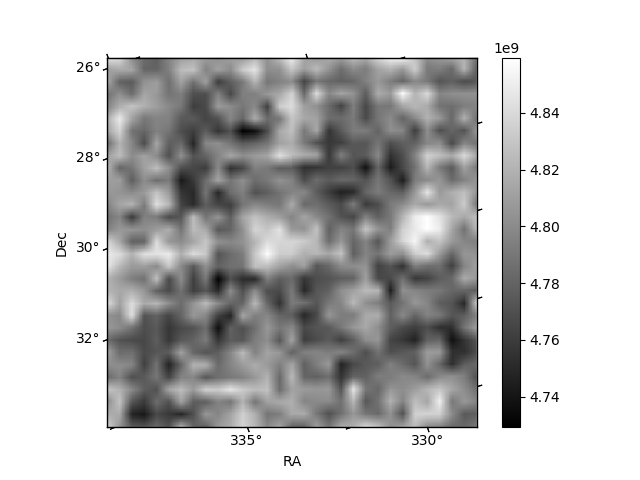
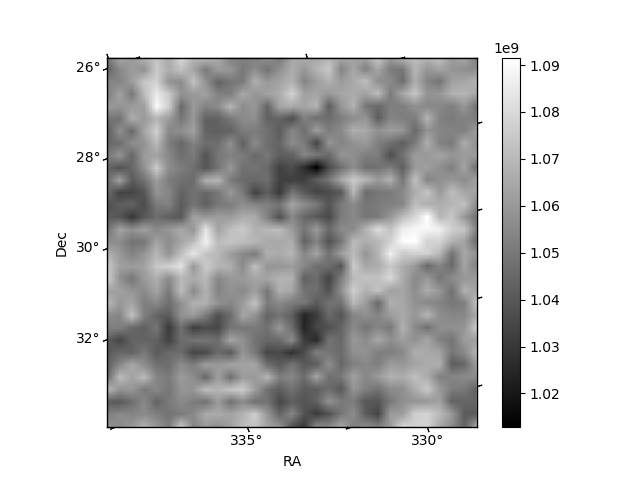
Histogram calculated using DETX and DETY for each event in the final _common_clean file
| Quadrant A |  |
 |
Quadrant B |
|---|---|---|---|
| Quadrant D |  |
 |
Quadrant C |
| Plot type | Count rate plots | Images |
|---|---|---|
| Comparison with Poisson distribution Blue bars denote a histogram of data divided into 1 sec bins. Red curve is a Poisson curve with rate = median count rate of data. |
 |
 |
| Quadrant-wise count rates Data is divided into 100 sec bins |
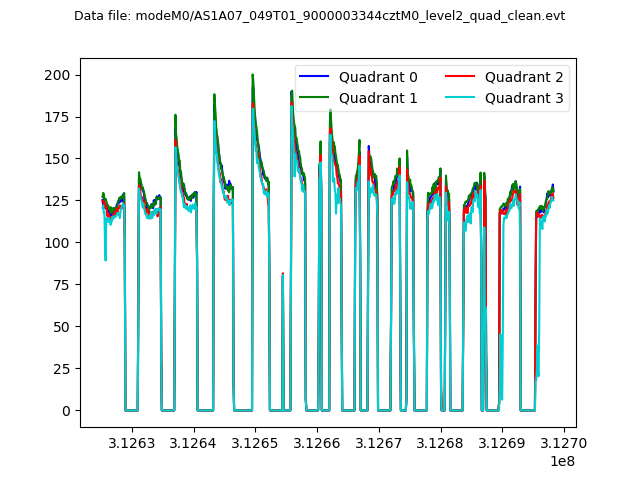 |
|
| Module-wise count rates for Quadrant A Data is divided into 100 sec bins |
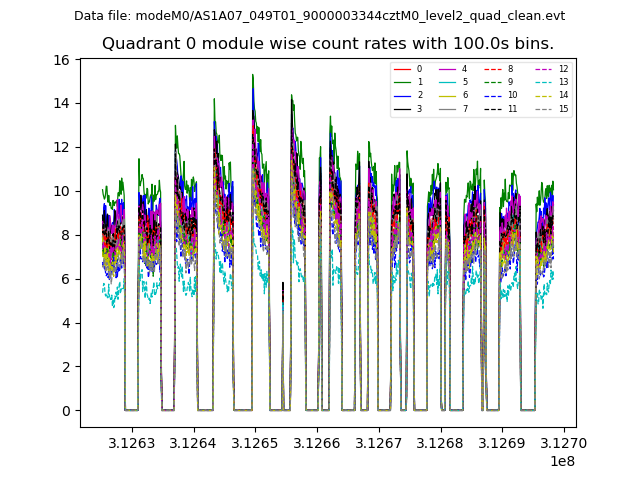 |
 |
| Module-wise count rates for Quadrant B Data is divided into 100 sec bins |
 |
 |
| Module-wise count rates for Quadrant C Data is divided into 100 sec bins |
 |
 |
| Module-wise count rates for Quadrant D Data is divided into 100 sec bins |
 |
 |
| Parameter | Plot |
|---|---|
| CZT HV Monitor |  |
| D_VDD |  |
| Temperature 1 | 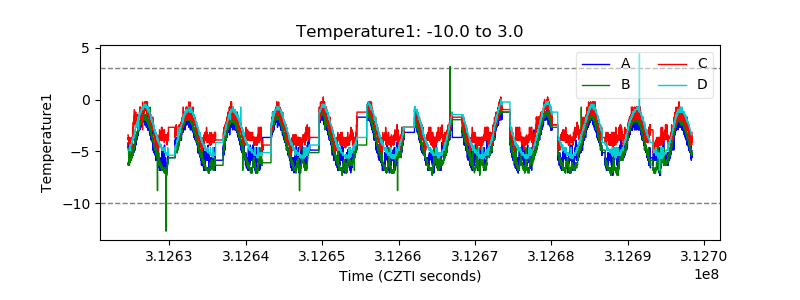 |
| Veto HV Monitor |  |
| Veto LLD |  |
| Alpha Counter |  |
| _CPM_Rate |  |
| CZT Counter | 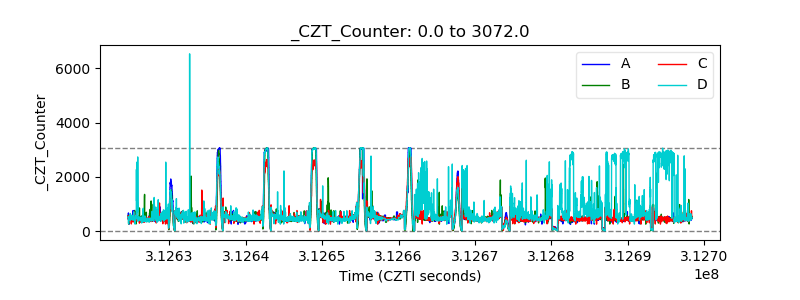 |
| +2.5 Volts monitor |  |
| +5 Volts monitor |  |
| _ROLL_ROT | 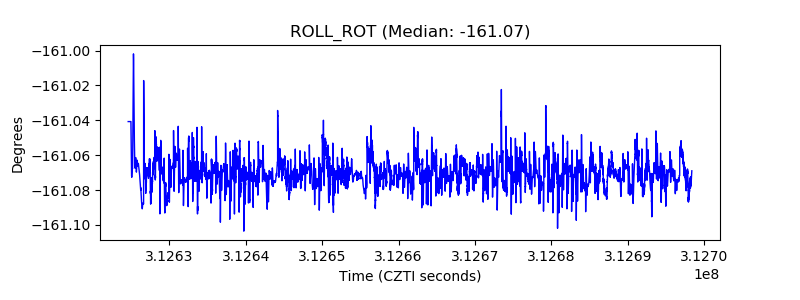 |
| _Roll_DEC |  |
| _Roll_RA |  |
| Veto Counter |  |