| Param | Original file | Final file |
|---|---|---|
| Filename | modeM0/AS1A08_003T01_9000003342cztM0_level2_bc.evt | modeM0/AS1A08_003T01_9000003342cztM0_level2_quad_clean.evt |
| Size (bytes) | 3,887,305,920 | 1,436,083,200 |
| Size | 3.6 GB | 1.3 GB |
| Events in quadrant A | 23,140,701 | 9,042,730 |
| Events in quadrant B | 25,712,325 | 9,219,238 |
| Events in quadrant C | 22,886,048 | 8,927,474 |
| Events in quadrant D | 38,388,405 | 8,665,212 |
| Mode M9 | |||
|---|---|---|---|
| Quadrant | BADHDUFLAG | Total packets | Discarded packets |
| A | 0 | 162 | 0 |
| B | 0 | 162 | 0 |
| C | 0 | 162 | 0 |
| D | 0 | 162 | 0 |
| Mode M0 | |||
|---|---|---|---|
| Quadrant | BADHDUFLAG | Total packets | Discarded packets |
| A | 0 | 232691 | 0 |
| B | 0 | 245545 | 0 |
| C | 0 | 234841 | 0 |
| D | 0 | 283191 | 0 |
| Mode SS | |||
|---|---|---|---|
| Quadrant | BADHDUFLAG | Total packets | Discarded packets |
| A | 0 | 2272 | 0 |
| B | 0 | 2272 | 0 |
| C | 0 | 2272 | 0 |
| D | 0 | 2272 | 0 |
| Quadrant | Total seconds | Saturated seconds | Saturation percentage |
|---|---|---|---|
| A | 111543 | 1101 | 0.987063% |
| B | 111543 | 2240 | 2.008194% |
| C | 111543 | 1965 | 1.761652% |
| D | 111543 | 4494 | 4.028940% |
Noise dominated data is calculated using 1-second bins in cleaned event files. If a bin has >2000 counts, and if more than 50% of those come from <1% of pixels, then it is considered to be noise-dominated and hence unusable.
| Quadrant | # 1 sec bins | Bins with >0 counts | Bins with >2000 counts | High rate bins dominated by noise | Noise dominated (total time) | Noise dominated (detector-on time) | Marked lightcurve |
|---|---|---|---|---|---|---|---|
| A | 127769 | 111529 | 0 | 0 | 0.00% | 0.00% | 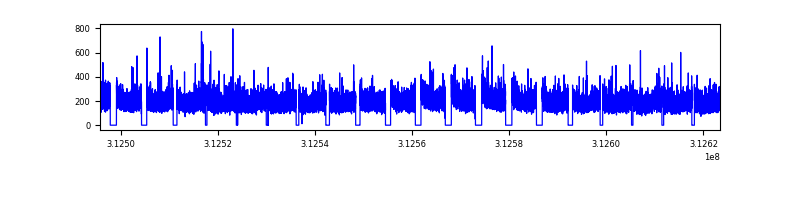 |
| B | 127769 | 111524 | 8 | 8 | 0.01% | 0.01% |  |
| C | 127769 | 111529 | 1 | 1 | 0.00% | 0.00% |  |
| D | 127769 | 111532 | 1056 | 1056 | 0.83% | 0.95% |  |
Top three noisy pixels from each quadrant. If the there are fewer than three noisy pixels in the level2.evt file, extra rows are filled as -1
| Pixel properties | Quadrant properties | ||||||
|---|---|---|---|---|---|---|---|
| Quadrant | DetID | PixID | Counts | Sigma | Mean | Median | Sigma |
| A | 13 | 254 | 167697 | 124.85 | 5987 | 5876 | 1296.2 |
| A | 3 | 1 | 43749 | 29.22 | 5987 | 5876 | 1296.2 |
| A | 0 | 226 | 38805 | 25.4 | 5987 | 5876 | 1296.2 |
| B | 15 | 33 | 1848894 | 1635.26 | 6036 | 5882 | 1127.0 |
| B | 0 | 245 | 137716 | 116.97 | 6036 | 5882 | 1127.0 |
| B | 5 | 172 | 126569 | 107.08 | 6036 | 5882 | 1127.0 |
| C | 0 | 10 | 138580 | 97.48 | 5840 | 5818 | 1362.0 |
| C | 10 | 22 | 136287 | 95.79 | 5840 | 5818 | 1362.0 |
| C | 10 | 91 | 71330 | 48.1 | 5840 | 5818 | 1362.0 |
| D | 1 | 52 | 12489860 | 9179.56 | 5878 | 5674 | 1360.0 |
| D | 12 | 227 | 1550727 | 1136.07 | 5878 | 5674 | 1360.0 |
| D | 13 | 172 | 497604 | 361.71 | 5878 | 5674 | 1360.0 |
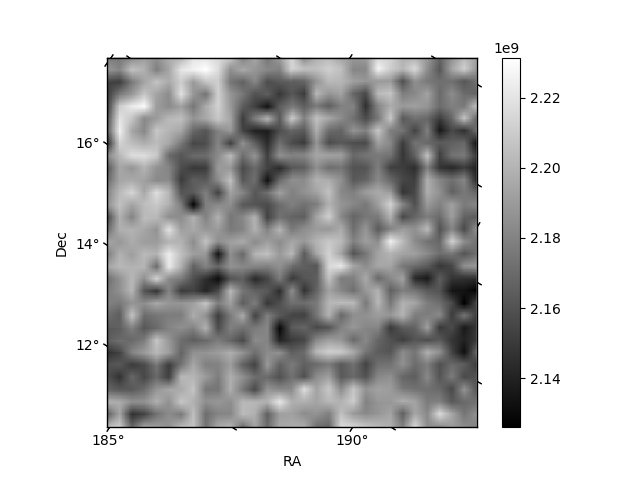
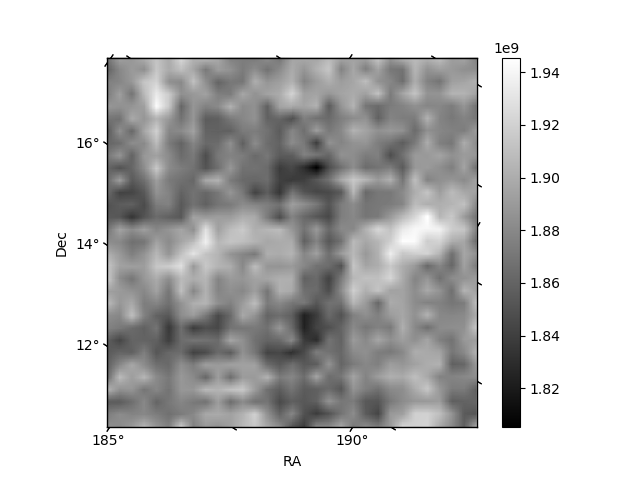
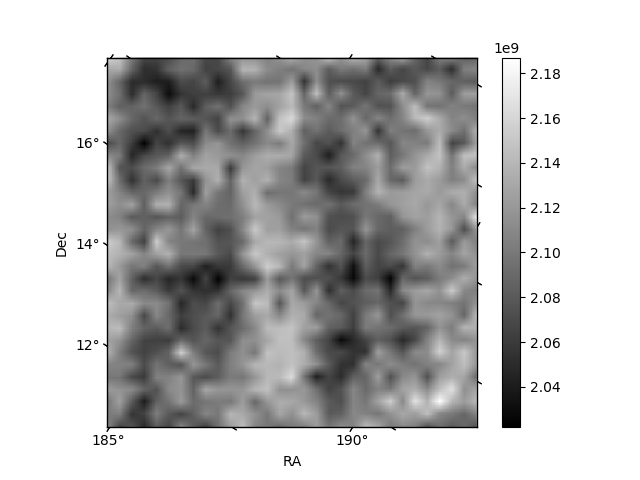
Histogram calculated using DETX and DETY for each event in the final _common_clean file
| Quadrant A |  |
 |
Quadrant B |
|---|---|---|---|
| Quadrant D |  |
 |
Quadrant C |
| Plot type | Count rate plots | Images |
|---|---|---|
| Comparison with Poisson distribution Blue bars denote a histogram of data divided into 1 sec bins. Red curve is a Poisson curve with rate = median count rate of data. |
 |
 |
| Quadrant-wise count rates Data is divided into 100 sec bins |
 |
|
| Module-wise count rates for Quadrant A Data is divided into 100 sec bins |
 |
 |
| Module-wise count rates for Quadrant B Data is divided into 100 sec bins |
 |
 |
| Module-wise count rates for Quadrant C Data is divided into 100 sec bins |
 |
 |
| Module-wise count rates for Quadrant D Data is divided into 100 sec bins |
 |
 |
| Parameter | Plot |
|---|---|
| CZT HV Monitor |  |
| D_VDD |  |
| Temperature 1 |  |
| Veto HV Monitor |  |
| Veto LLD |  |
| Alpha Counter | 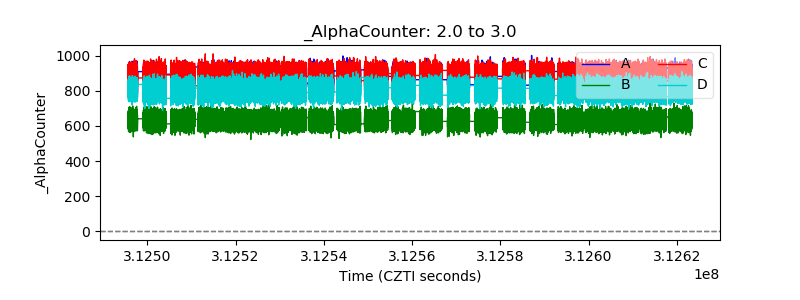 |
| _CPM_Rate | 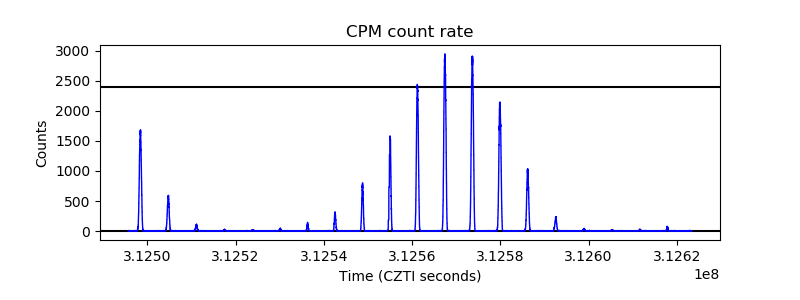 |
| CZT Counter |  |
| +2.5 Volts monitor |  |
| +5 Volts monitor |  |
| _ROLL_ROT |  |
| _Roll_DEC |  |
| _Roll_RA |  |
| Veto Counter |  |