| Param | Original file | Final file |
|---|---|---|
| Filename | modeM0/AS1T03_149T08_9000003334cztM0_level2_bc.evt | modeM0/AS1T03_149T08_9000003334cztM0_level2_quad_clean.evt |
| Size (bytes) | 144,518,400 | 49,985,280 |
| Size | 137.8 MB | 47.7 MB |
| Events in quadrant A | 830,210 | 306,308 |
| Events in quadrant B | 1,465,899 | 305,925 |
| Events in quadrant C | 811,474 | 298,706 |
| Events in quadrant D | 962,528 | 294,192 |
| Mode M0 | |||
|---|---|---|---|
| Quadrant | BADHDUFLAG | Total packets | Discarded packets |
| A | 0 | 8996 | 0 |
| B | 0 | 11378 | 0 |
| C | 0 | 8998 | 0 |
| D | 0 | 9409 | 0 |
| Mode SS | |||
|---|---|---|---|
| Quadrant | BADHDUFLAG | Total packets | Discarded packets |
| A | 0 | 88 | 0 |
| B | 0 | 88 | 0 |
| C | 0 | 88 | 0 |
| D | 0 | 88 | 0 |
| Mode M9 | |||
|---|---|---|---|
| Quadrant | BADHDUFLAG | Total packets | Discarded packets |
| A | 0 | 2 | 0 |
| B | 0 | 2 | 0 |
| C | 0 | 2 | 0 |
| D | 0 | 2 | 0 |
| Quadrant | Total seconds | Saturated seconds | Saturation percentage |
|---|---|---|---|
| A | 4385 | 104 | 2.371722% |
| B | 4385 | 312 | 7.115165% |
| C | 4385 | 122 | 2.782212% |
| D | 4385 | 112 | 2.554162% |
Noise dominated data is calculated using 1-second bins in cleaned event files. If a bin has >2000 counts, and if more than 50% of those come from <1% of pixels, then it is considered to be noise-dominated and hence unusable.
| Quadrant | # 1 sec bins | Bins with >0 counts | Bins with >2000 counts | High rate bins dominated by noise | Noise dominated (total time) | Noise dominated (detector-on time) | Marked lightcurve |
|---|---|---|---|---|---|---|---|
| A | 4550 | 4384 | 0 | 0 | 0.00% | 0.00% |  |
| B | 4550 | 4384 | 19 | 19 | 0.42% | 0.43% |  |
| C | 4550 | 4385 | 0 | 0 | 0.00% | 0.00% |  |
| D | 4550 | 4385 | 0 | 0 | 0.00% | 0.00% |  |
Top three noisy pixels from each quadrant. If the there are fewer than three noisy pixels in the level2.evt file, extra rows are filled as -1
| Pixel properties | Quadrant properties | ||||||
|---|---|---|---|---|---|---|---|
| Quadrant | DetID | PixID | Counts | Sigma | Mean | Median | Sigma |
| A | 13 | 254 | 5012 | 98.33 | 213 | 209 | 48.8 |
| A | 3 | 1 | 2789 | 52.82 | 213 | 209 | 48.8 |
| A | 15 | 48 | 2159 | 39.92 | 213 | 209 | 48.8 |
| B | 10 | 245 | 633543 | 14784.48 | 212 | 207 | 42.8 |
| B | 4 | 173 | 6198 | 139.85 | 212 | 207 | 42.8 |
| B | 12 | 0 | 4358 | 96.9 | 212 | 207 | 42.8 |
| C | 10 | 22 | 4748 | 86.45 | 209 | 206 | 52.5 |
| C | 13 | 61 | 1172 | 18.39 | 209 | 206 | 52.5 |
| C | 0 | 239 | 863 | 12.5 | 209 | 206 | 52.5 |
| D | 13 | 172 | 70252 | 1360.32 | 213 | 204 | 51.5 |
| D | 7 | 223 | 35582 | 687.03 | 213 | 204 | 51.5 |
| D | 9 | 85 | 21007 | 403.99 | 213 | 204 | 51.5 |
Histogram calculated using DETX and DETY for each event in the final _common_clean file
| Quadrant A |  |
 |
Quadrant B |
|---|---|---|---|
| Quadrant D |  |
 |
Quadrant C |
| Plot type | Count rate plots | Images |
|---|---|---|
| Comparison with Poisson distribution Blue bars denote a histogram of data divided into 1 sec bins. Red curve is a Poisson curve with rate = median count rate of data. |
 |
 |
| Quadrant-wise count rates Data is divided into 100 sec bins |
 |
|
| Module-wise count rates for Quadrant A Data is divided into 100 sec bins |
 |
 |
| Module-wise count rates for Quadrant B Data is divided into 100 sec bins |
 |
 |
| Module-wise count rates for Quadrant C Data is divided into 100 sec bins |
 |
 |
| Module-wise count rates for Quadrant D Data is divided into 100 sec bins |
 |
 |
| Parameter | Plot |
|---|---|
| CZT HV Monitor |  |
| D_VDD |  |
| Temperature 1 |  |
| Veto HV Monitor | 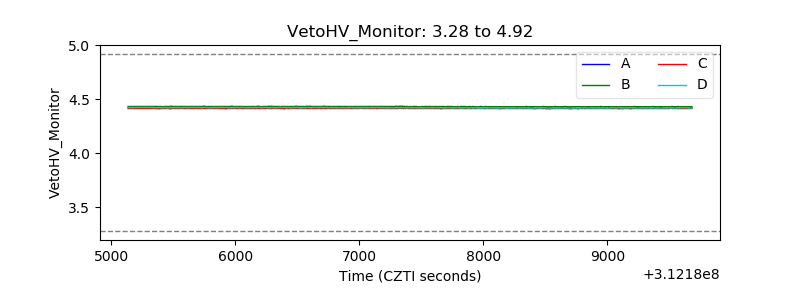 |
| Veto LLD |  |
| Alpha Counter |  |
| _CPM_Rate | 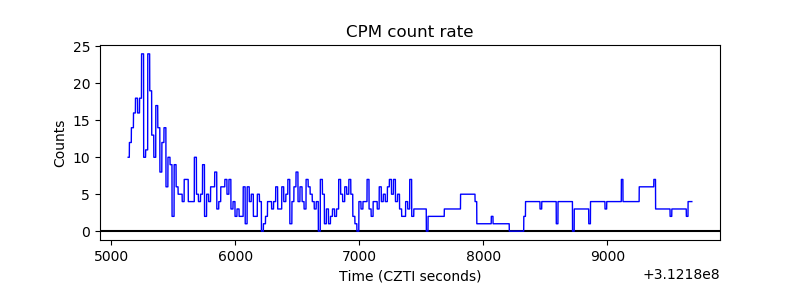 |
| CZT Counter |  |
| +2.5 Volts monitor |  |
| +5 Volts monitor |  |
| _ROLL_ROT |  |
| _Roll_DEC |  |
| _Roll_RA | 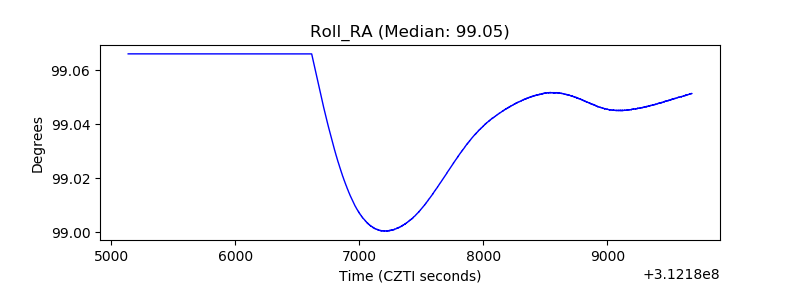 |
| Veto Counter |  |