| Param | Original file | Final file |
|---|---|---|
| Filename | modeM0/AS1T03_149T07_9000003332cztM0_level2_bc.evt | modeM0/AS1T03_149T07_9000003332cztM0_level2_quad_clean.evt |
| Size (bytes) | 126,944,640 | 39,913,920 |
| Size | 121.1 MB | 38.1 MB |
| Events in quadrant A | 700,924 | 241,659 |
| Events in quadrant B | 1,334,812 | 236,255 |
| Events in quadrant C | 723,649 | 234,680 |
| Events in quadrant D | 824,962 | 233,907 |
| Mode SS | |||
|---|---|---|---|
| Quadrant | BADHDUFLAG | Total packets | Discarded packets |
| A | 0 | 74 | 0 |
| B | 0 | 74 | 0 |
| C | 0 | 74 | 0 |
| D | 0 | 74 | 0 |
| Mode M0 | |||
|---|---|---|---|
| Quadrant | BADHDUFLAG | Total packets | Discarded packets |
| A | 0 | 7411 | 0 |
| B | 0 | 9546 | 0 |
| C | 0 | 7522 | 0 |
| D | 0 | 7747 | 0 |
| Quadrant | Total seconds | Saturated seconds | Saturation percentage |
|---|---|---|---|
| A | 3697 | 4 | 0.108196% |
| B | 3697 | 196 | 5.301596% |
| C | 3697 | 16 | 0.432783% |
| D | 3697 | 13 | 0.351636% |
Noise dominated data is calculated using 1-second bins in cleaned event files. If a bin has >2000 counts, and if more than 50% of those come from <1% of pixels, then it is considered to be noise-dominated and hence unusable.
| Quadrant | # 1 sec bins | Bins with >0 counts | Bins with >2000 counts | High rate bins dominated by noise | Noise dominated (total time) | Noise dominated (detector-on time) | Marked lightcurve |
|---|---|---|---|---|---|---|---|
| A | 3697 | 3697 | 0 | 0 | 0.00% | 0.00% |  |
| B | 3697 | 3697 | 40 | 40 | 1.08% | 1.08% |  |
| C | 3697 | 3697 | 0 | 0 | 0.00% | 0.00% |  |
| D | 3697 | 3697 | 2 | 2 | 0.05% | 0.05% |  |
Top three noisy pixels from each quadrant. If the there are fewer than three noisy pixels in the level2.evt file, extra rows are filled as -1
| Pixel properties | Quadrant properties | ||||||
|---|---|---|---|---|---|---|---|
| Quadrant | DetID | PixID | Counts | Sigma | Mean | Median | Sigma |
| A | 13 | 254 | 4240 | 95.27 | 181 | 178 | 42.6 |
| A | 0 | 226 | 1144 | 22.66 | 181 | 178 | 42.6 |
| A | 12 | 194 | 1092 | 21.44 | 181 | 178 | 42.6 |
| B | 10 | 245 | 629898 | 16832.8 | 180 | 175 | 37.4 |
| B | 0 | 190 | 5941 | 154.13 | 180 | 175 | 37.4 |
| B | 0 | 214 | 4530 | 116.41 | 180 | 175 | 37.4 |
| C | 10 | 22 | 40063 | 891.81 | 177 | 175 | 44.7 |
| C | 13 | 61 | 1029 | 19.09 | 177 | 175 | 44.7 |
| C | 3 | 9 | 688 | 11.47 | 177 | 175 | 44.7 |
| D | 1 | 52 | 81121 | 1801.82 | 181 | 174 | 44.9 |
| D | 13 | 172 | 20171 | 445.12 | 181 | 174 | 44.9 |
| D | 2 | 234 | 14780 | 325.12 | 181 | 174 | 44.9 |
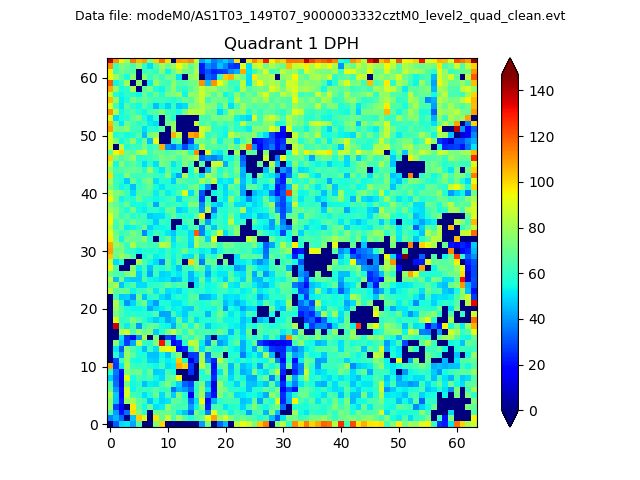
Histogram calculated using DETX and DETY for each event in the final _common_clean file
| Quadrant A |  |
 |
Quadrant B |
|---|---|---|---|
| Quadrant D |  |
 |
Quadrant C |
| Plot type | Count rate plots | Images |
|---|---|---|
| Comparison with Poisson distribution Blue bars denote a histogram of data divided into 1 sec bins. Red curve is a Poisson curve with rate = median count rate of data. |
 |
 |
| Quadrant-wise count rates Data is divided into 100 sec bins |
 |
|
| Module-wise count rates for Quadrant A Data is divided into 100 sec bins |
 |
 |
| Module-wise count rates for Quadrant B Data is divided into 100 sec bins |
 |
 |
| Module-wise count rates for Quadrant C Data is divided into 100 sec bins |
 |
 |
| Module-wise count rates for Quadrant D Data is divided into 100 sec bins |
 |
 |
| Parameter | Plot |
|---|---|
| CZT HV Monitor |  |
| D_VDD |  |
| Temperature 1 |  |
| Veto HV Monitor |  |
| Veto LLD |  |
| Alpha Counter |  |
| _CPM_Rate |  |
| CZT Counter |  |
| +2.5 Volts monitor | 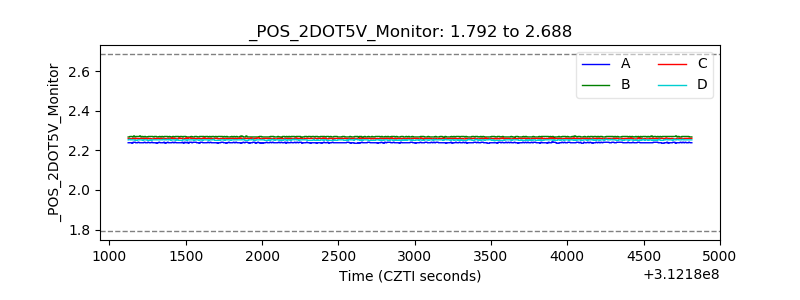 |
| +5 Volts monitor |  |
| _ROLL_ROT |  |
| _Roll_DEC |  |
| _Roll_RA |  |
| Veto Counter |  |