| Param | Original file | Final file |
|---|---|---|
| Filename | modeM0/AS1A07_065T01_9000003338cztM0_level2_bc.evt | modeM0/AS1A07_065T01_9000003338cztM0_level2_quad_clean.evt |
| Size (bytes) | 1,712,324,160 | 722,897,280 |
| Size | 1.6 GB | 689.4 MB |
| Events in quadrant A | 10,822,614 | 4,676,322 |
| Events in quadrant B | 13,968,553 | 4,703,230 |
| Events in quadrant C | 10,890,501 | 4,563,120 |
| Events in quadrant D | 12,717,340 | 4,475,137 |
| Mode SS | |||
|---|---|---|---|
| Quadrant | BADHDUFLAG | Total packets | Discarded packets |
| A | 0 | 1034 | 0 |
| B | 0 | 1034 | 0 |
| C | 0 | 1034 | 0 |
| D | 0 | 1034 | 0 |
| Mode M0 | |||
|---|---|---|---|
| Quadrant | BADHDUFLAG | Total packets | Discarded packets |
| A | 0 | 106269 | 0 |
| B | 0 | 117787 | 0 |
| C | 0 | 108474 | 0 |
| D | 0 | 112583 | 0 |
| Mode M9 | |||
|---|---|---|---|
| Quadrant | BADHDUFLAG | Total packets | Discarded packets |
| A | 0 | 105 | 0 |
| B | 0 | 105 | 0 |
| C | 0 | 105 | 0 |
| D | 0 | 105 | 0 |
| Quadrant | Total seconds | Saturated seconds | Saturation percentage |
|---|---|---|---|
| A | 50704 | 433 | 0.853976% |
| B | 50704 | 840 | 1.656674% |
| C | 50704 | 858 | 1.692174% |
| D | 50704 | 822 | 1.621174% |
Noise dominated data is calculated using 1-second bins in cleaned event files. If a bin has >2000 counts, and if more than 50% of those come from <1% of pixels, then it is considered to be noise-dominated and hence unusable.
| Quadrant | # 1 sec bins | Bins with >0 counts | Bins with >2000 counts | High rate bins dominated by noise | Noise dominated (total time) | Noise dominated (detector-on time) | Marked lightcurve |
|---|---|---|---|---|---|---|---|
| A | 61179 | 50698 | 0 | 0 | 0.00% | 0.00% | 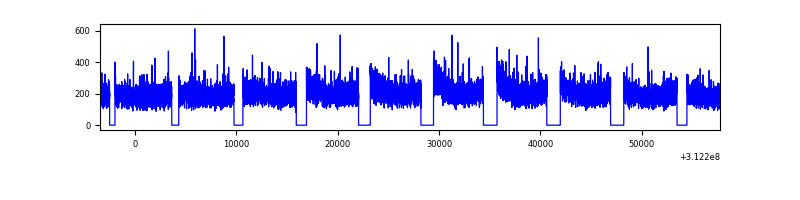 |
| B | 61179 | 50697 | 21 | 21 | 0.03% | 0.04% |  |
| C | 61179 | 50697 | 5 | 5 | 0.01% | 0.01% | 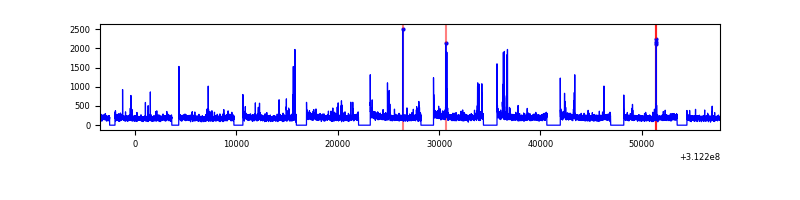 |
| D | 61179 | 50697 | 113 | 113 | 0.18% | 0.22% |  |
Top three noisy pixels from each quadrant. If the there are fewer than three noisy pixels in the level2.evt file, extra rows are filled as -1
| Pixel properties | Quadrant properties | ||||||
|---|---|---|---|---|---|---|---|
| Quadrant | DetID | PixID | Counts | Sigma | Mean | Median | Sigma |
| A | 15 | 174 | 69942 | 111.5 | 2788 | 2743 | 602.7 |
| A | 13 | 254 | 68230 | 108.66 | 2788 | 2743 | 602.7 |
| A | 0 | 226 | 17684 | 24.79 | 2788 | 2743 | 602.7 |
| B | 0 | 244 | 2364167 | 4529.41 | 2807 | 2744 | 521.4 |
| B | 10 | 245 | 470808 | 897.79 | 2807 | 2744 | 521.4 |
| B | 5 | 172 | 114807 | 214.95 | 2807 | 2744 | 521.4 |
| C | 10 | 22 | 299146 | 468.07 | 2710 | 2696 | 633.3 |
| C | 9 | 54 | 130160 | 201.25 | 2710 | 2696 | 633.3 |
| C | 0 | 10 | 59681 | 89.97 | 2710 | 2696 | 633.3 |
| D | 1 | 52 | 1152679 | 1818.26 | 2760 | 2674 | 632.5 |
| D | 13 | 249 | 396284 | 622.33 | 2760 | 2674 | 632.5 |
| D | 2 | 234 | 215099 | 335.86 | 2760 | 2674 | 632.5 |
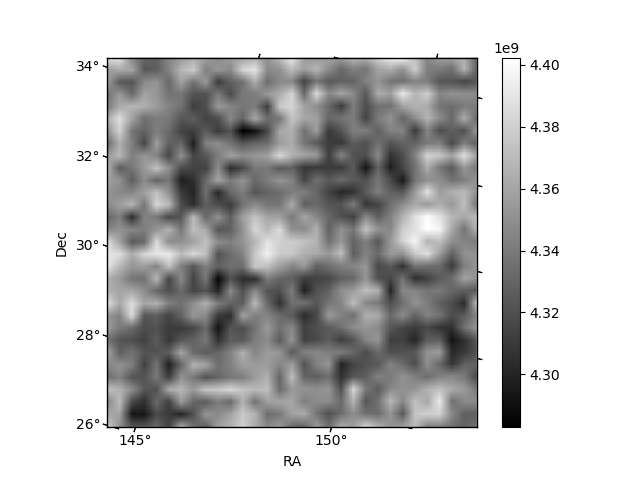
Histogram calculated using DETX and DETY for each event in the final _common_clean file
| Quadrant A | 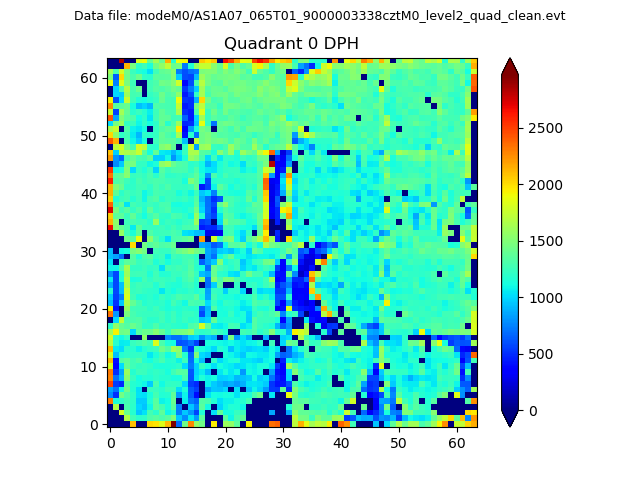 |
 |
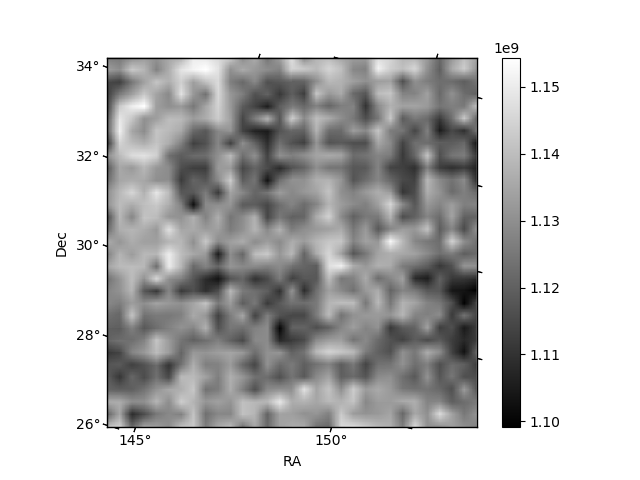
Quadrant B |
|---|---|---|---|
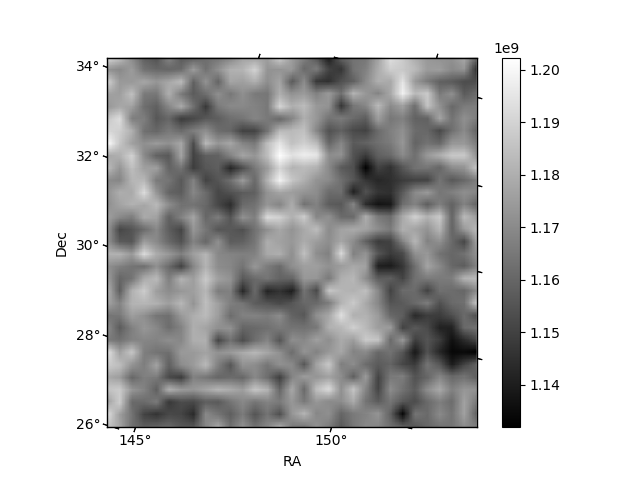
| Quadrant D | 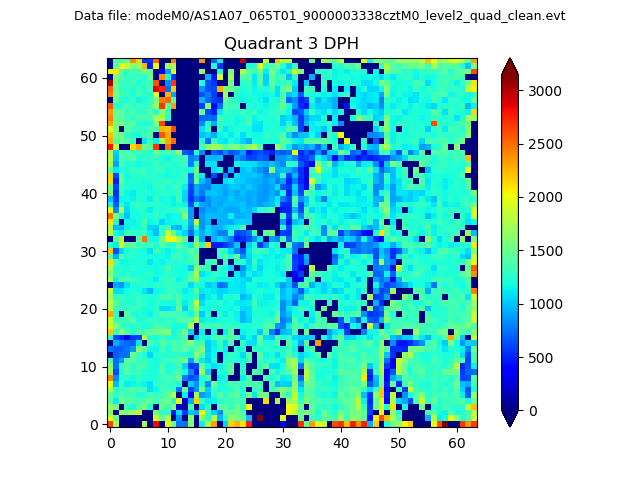 |
 |
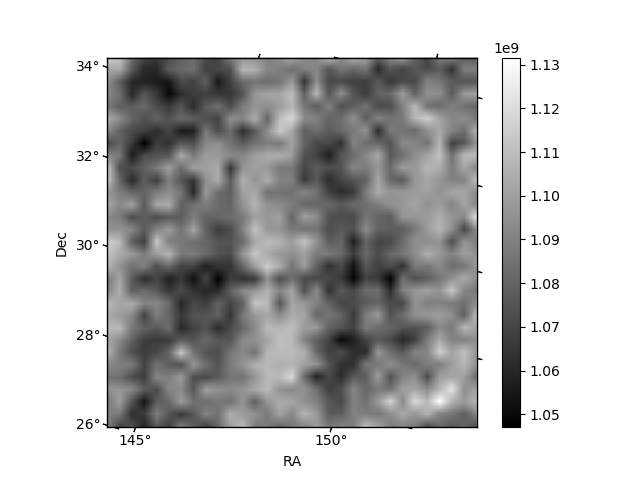
Quadrant C |
| Plot type | Count rate plots | Images |
|---|---|---|
| Comparison with Poisson distribution Blue bars denote a histogram of data divided into 1 sec bins. Red curve is a Poisson curve with rate = median count rate of data. |
 |
 |
| Quadrant-wise count rates Data is divided into 100 sec bins |
 |
|
| Module-wise count rates for Quadrant A Data is divided into 100 sec bins |
 |
 |
| Module-wise count rates for Quadrant B Data is divided into 100 sec bins |
 |
 |
| Module-wise count rates for Quadrant C Data is divided into 100 sec bins |
 |
 |
| Module-wise count rates for Quadrant D Data is divided into 100 sec bins |
 |
 |
| Parameter | Plot |
|---|---|
| CZT HV Monitor |  |
| D_VDD |  |
| Temperature 1 |  |
| Veto HV Monitor |  |
| Veto LLD | 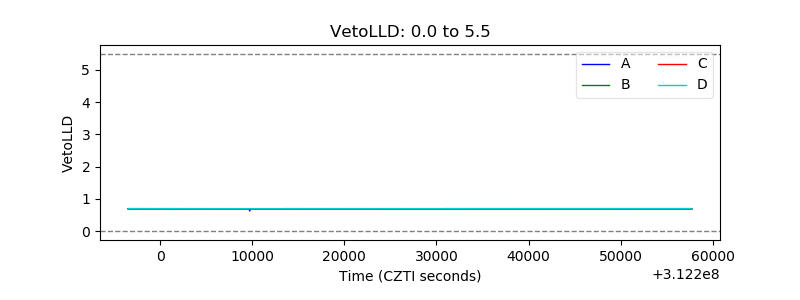 |
| Alpha Counter |  |
| _CPM_Rate |  |
| CZT Counter |  |
| +2.5 Volts monitor | 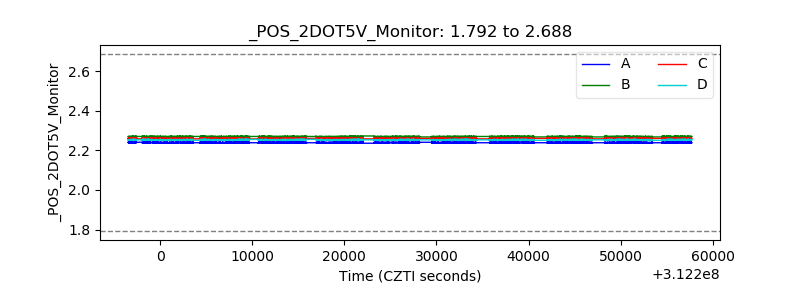 |
| +5 Volts monitor |  |
| _ROLL_ROT |  |
| _Roll_DEC |  |
| _Roll_RA |  |
| Veto Counter |  |