| Param | Original file | Final file |
|---|---|---|
| Filename | modeM0/AS1T03_159T01_9000003328cztM0_level2_bc.evt | modeM0/AS1T03_159T01_9000003328cztM0_level2_quad_clean.evt |
| Size (bytes) | 1,483,352,640 | 691,231,680 |
| Size | 1.4 GB | 659.2 MB |
| Events in quadrant A | 9,970,130 | 4,510,960 |
| Events in quadrant B | 10,721,201 | 4,623,047 |
| Events in quadrant C | 9,407,031 | 4,343,685 |
| Events in quadrant D | 11,640,049 | 4,257,971 |
| Mode M9 | |||
|---|---|---|---|
| Quadrant | BADHDUFLAG | Total packets | Discarded packets |
| A | 0 | 74 | 0 |
| B | 0 | 74 | 0 |
| C | 0 | 74 | 0 |
| D | 0 | 74 | 0 |
| Mode SS | |||
|---|---|---|---|
| Quadrant | BADHDUFLAG | Total packets | Discarded packets |
| A | 0 | 952 | 0 |
| B | 0 | 952 | 0 |
| C | 0 | 952 | 0 |
| D | 0 | 952 | 0 |
| Mode M0 | |||
|---|---|---|---|
| Quadrant | BADHDUFLAG | Total packets | Discarded packets |
| A | 0 | 97532 | 0 |
| B | 0 | 100046 | 0 |
| C | 0 | 97192 | 0 |
| D | 0 | 101797 | 0 |
| Quadrant | Total seconds | Saturated seconds | Saturation percentage |
|---|---|---|---|
| A | 46648 | 607 | 1.301235% |
| B | 46648 | 773 | 1.657091% |
| C | 46648 | 844 | 1.809295% |
| D | 46648 | 647 | 1.386983% |
Noise dominated data is calculated using 1-second bins in cleaned event files. If a bin has >2000 counts, and if more than 50% of those come from <1% of pixels, then it is considered to be noise-dominated and hence unusable.
| Quadrant | # 1 sec bins | Bins with >0 counts | Bins with >2000 counts | High rate bins dominated by noise | Noise dominated (total time) | Noise dominated (detector-on time) | Marked lightcurve |
|---|---|---|---|---|---|---|---|
| A | 59201 | 46643 | 0 | 0 | 0.00% | 0.00% |  |
| B | 59201 | 46645 | 17 | 17 | 0.03% | 0.04% |  |
| C | 59201 | 46644 | 0 | 0 | 0.00% | 0.00% |  |
| D | 59201 | 46646 | 44 | 44 | 0.07% | 0.09% |  |
Top three noisy pixels from each quadrant. If the there are fewer than three noisy pixels in the level2.evt file, extra rows are filled as -1
| Pixel properties | Quadrant properties | ||||||
|---|---|---|---|---|---|---|---|
| Quadrant | DetID | PixID | Counts | Sigma | Mean | Median | Sigma |
| A | 3 | 1 | 128581 | 232.72 | 2497 | 2454 | 542.0 |
| A | 6 | 240 | 97138 | 174.7 | 2497 | 2454 | 542.0 |
| A | 15 | 174 | 84609 | 151.59 | 2497 | 2454 | 542.0 |
| B | 0 | 244 | 448544 | 931.66 | 2541 | 2478 | 478.8 |
| B | 6 | 36 | 279887 | 579.4 | 2541 | 2478 | 478.8 |
| B | 4 | 173 | 75135 | 151.75 | 2541 | 2478 | 478.8 |
| C | 1 | 16 | 54385 | 91.87 | 2410 | 2401 | 565.8 |
| C | 0 | 10 | 39475 | 65.52 | 2410 | 2401 | 565.8 |
| C | 9 | 54 | 18431 | 28.33 | 2410 | 2401 | 565.8 |
| D | 1 | 52 | 916476 | 1625.26 | 2446 | 2362 | 562.4 |
| D | 7 | 223 | 641838 | 1136.97 | 2446 | 2362 | 562.4 |
| D | 2 | 234 | 192704 | 338.42 | 2446 | 2362 | 562.4 |
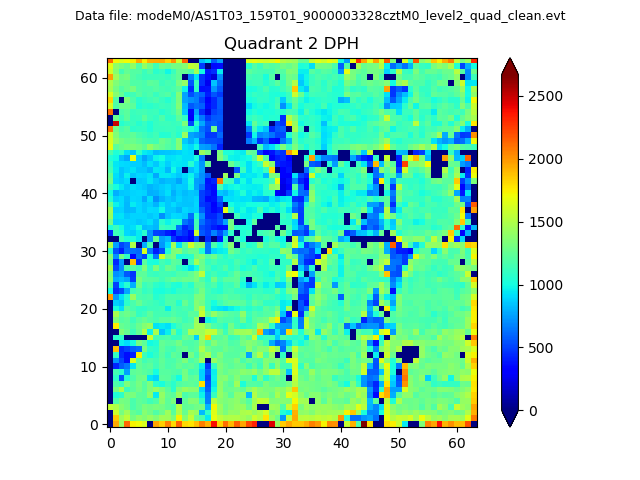
Histogram calculated using DETX and DETY for each event in the final _common_clean file
| Quadrant A |  |
 |
Quadrant B |
|---|---|---|---|
| Quadrant D | 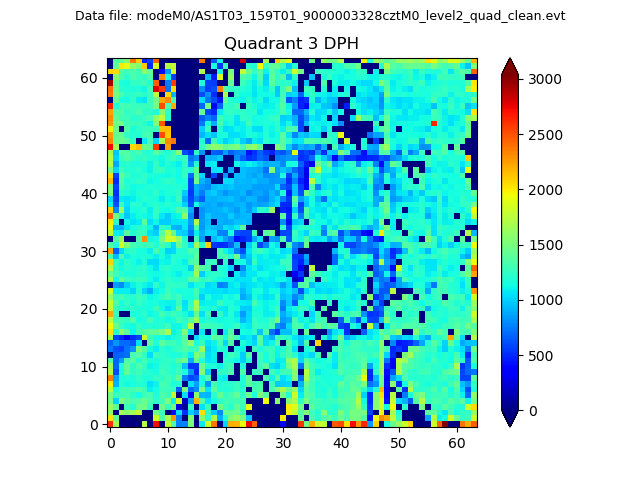 |
 |
Quadrant C |
| Plot type | Count rate plots | Images |
|---|---|---|
| Comparison with Poisson distribution Blue bars denote a histogram of data divided into 1 sec bins. Red curve is a Poisson curve with rate = median count rate of data. |
 |
 |
| Quadrant-wise count rates Data is divided into 100 sec bins |
 |
|
| Module-wise count rates for Quadrant A Data is divided into 100 sec bins |
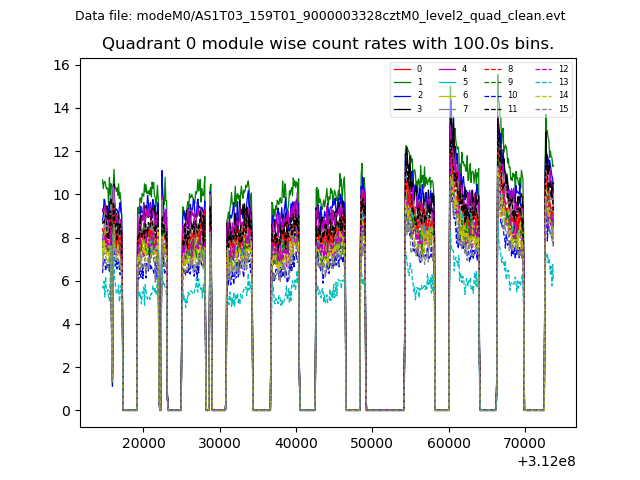 |
 |
| Module-wise count rates for Quadrant B Data is divided into 100 sec bins |
 |
 |
| Module-wise count rates for Quadrant C Data is divided into 100 sec bins |
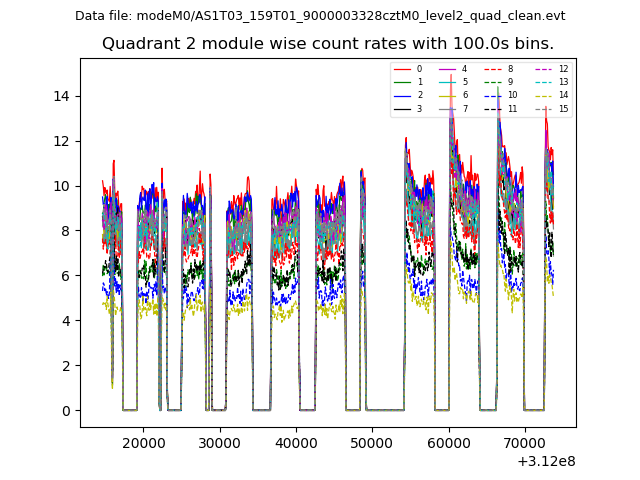 |
 |
| Module-wise count rates for Quadrant D Data is divided into 100 sec bins |
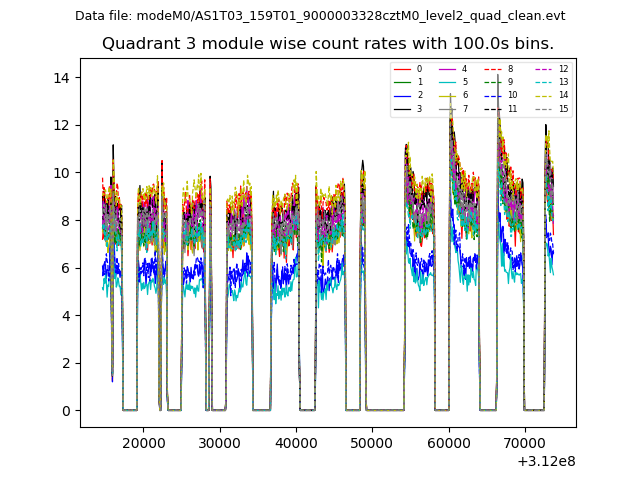 |
 |
| Parameter | Plot |
|---|---|
| CZT HV Monitor |  |
| D_VDD |  |
| Temperature 1 | 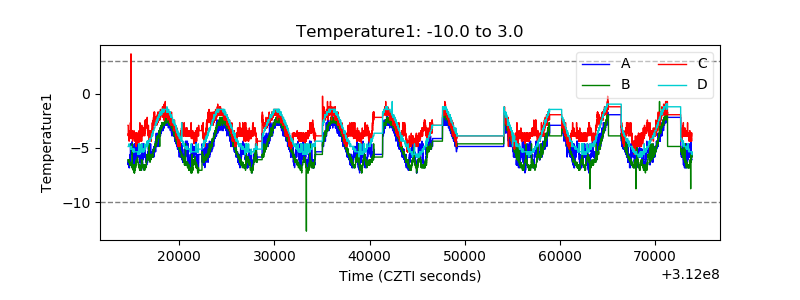 |
| Veto HV Monitor |  |
| Veto LLD |  |
| Alpha Counter | 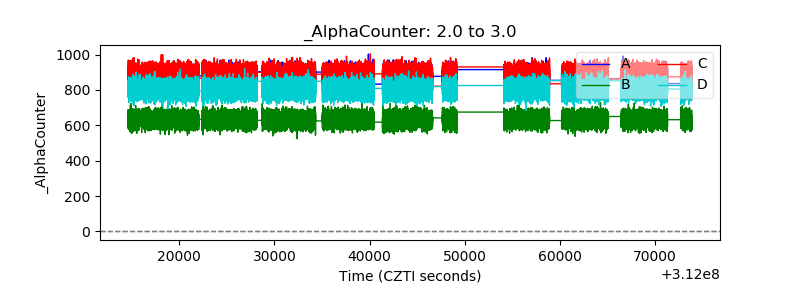 |
| _CPM_Rate |  |
| CZT Counter | 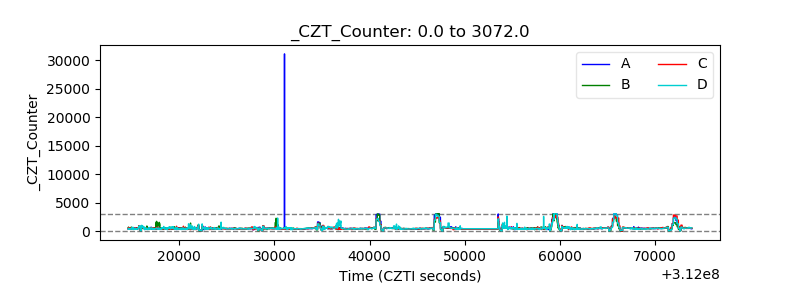 |
| +2.5 Volts monitor | 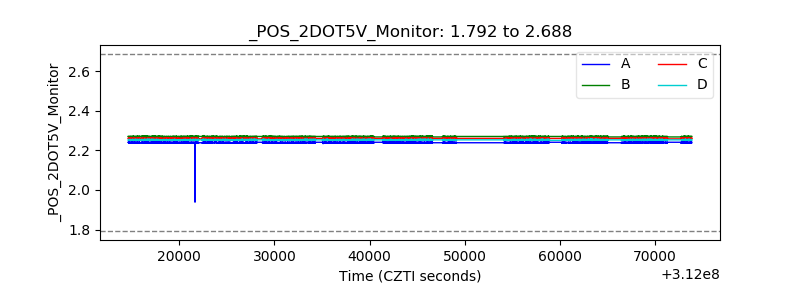 |
| +5 Volts monitor | 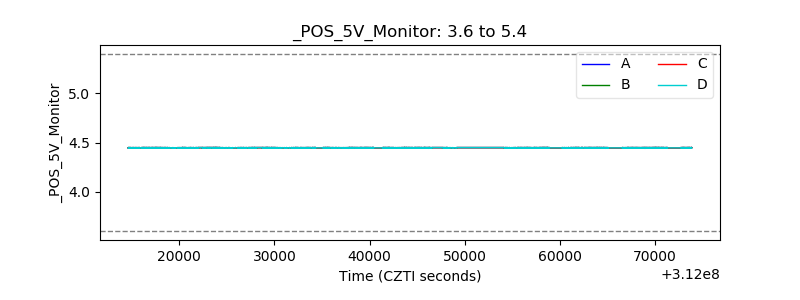 |
| _ROLL_ROT |  |
| _Roll_DEC |  |
| _Roll_RA |  |
| Veto Counter | 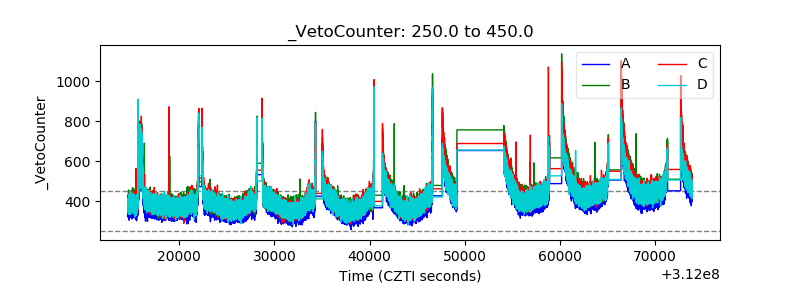 |