| Param | Original file | Final file |
|---|---|---|
| Filename | modeM0/AS1T03_149T05_9000003324cztM0_level2_bc.evt | modeM0/AS1T03_149T05_9000003324cztM0_level2_quad_clean.evt |
| Size (bytes) | 252,552,960 | 102,346,560 |
| Size | 240.9 MB | 97.6 MB |
| Events in quadrant A | 1,695,148 | 639,339 |
| Events in quadrant B | 1,936,796 | 654,840 |
| Events in quadrant C | 1,653,628 | 620,361 |
| Events in quadrant D | 1,792,045 | 610,957 |
| Mode SS | |||
|---|---|---|---|
| Quadrant | BADHDUFLAG | Total packets | Discarded packets |
| A | 0 | 168 | 0 |
| B | 0 | 168 | 0 |
| C | 0 | 168 | 0 |
| D | 0 | 168 | 0 |
| Mode M9 | |||
|---|---|---|---|
| Quadrant | BADHDUFLAG | Total packets | Discarded packets |
| A | 0 | 20 | 0 |
| B | 0 | 20 | 0 |
| C | 0 | 20 | 0 |
| D | 0 | 20 | 0 |
| Mode M0 | |||
|---|---|---|---|
| Quadrant | BADHDUFLAG | Total packets | Discarded packets |
| A | 0 | 17065 | 0 |
| B | 0 | 17688 | 0 |
| C | 0 | 17103 | 0 |
| D | 0 | 17253 | 0 |
| Quadrant | Total seconds | Saturated seconds | Saturation percentage |
|---|---|---|---|
| A | 8267 | 34 | 0.411274% |
| B | 8267 | 60 | 0.725777% |
| C | 8267 | 123 | 1.487843% |
| D | 8267 | 31 | 0.374985% |
Noise dominated data is calculated using 1-second bins in cleaned event files. If a bin has >2000 counts, and if more than 50% of those come from <1% of pixels, then it is considered to be noise-dominated and hence unusable.
| Quadrant | # 1 sec bins | Bins with >0 counts | Bins with >2000 counts | High rate bins dominated by noise | Noise dominated (total time) | Noise dominated (detector-on time) | Marked lightcurve |
|---|---|---|---|---|---|---|---|
| A | 13852 | 8268 | 0 | 0 | 0.00% | 0.00% | 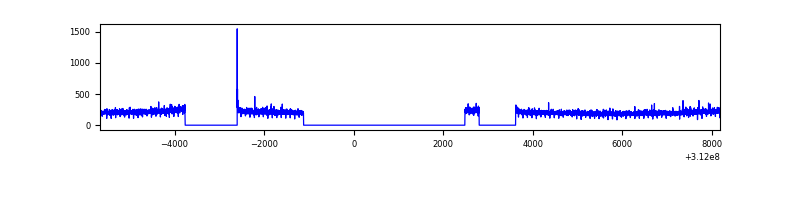 |
| B | 13852 | 8268 | 1 | 1 | 0.01% | 0.01% | 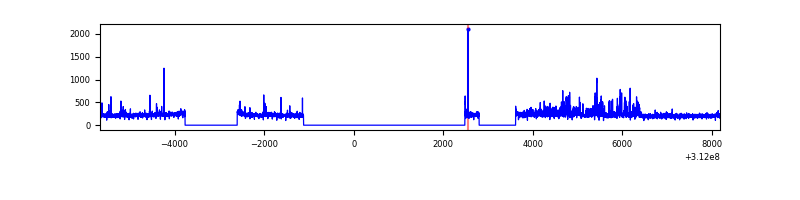 |
| C | 13852 | 8268 | 0 | 0 | 0.00% | 0.00% |  |
| D | 13852 | 8268 | 1 | 1 | 0.01% | 0.01% | 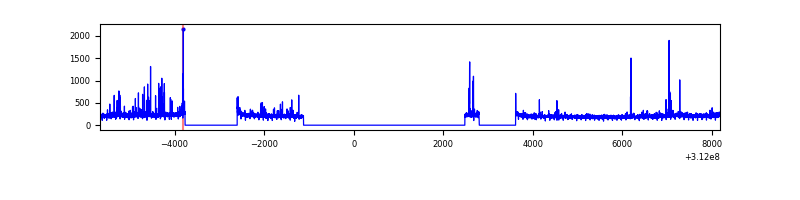 |
Top three noisy pixels from each quadrant. If the there are fewer than three noisy pixels in the level2.evt file, extra rows are filled as -1
| Pixel properties | Quadrant properties | ||||||
|---|---|---|---|---|---|---|---|
| Quadrant | DetID | PixID | Counts | Sigma | Mean | Median | Sigma |
| A | 15 | 174 | 15025 | 151.63 | 433 | 423 | 96.3 |
| A | 13 | 254 | 11385 | 113.83 | 433 | 423 | 96.3 |
| A | 3 | 1 | 5019 | 47.73 | 433 | 423 | 96.3 |
| B | 0 | 244 | 199006 | 2323.42 | 442 | 430 | 85.5 |
| B | 3 | 64 | 16773 | 191.22 | 442 | 430 | 85.5 |
| B | 0 | 190 | 11754 | 132.5 | 442 | 430 | 85.5 |
| C | 0 | 10 | 4989 | 44.75 | 425 | 422 | 102.1 |
| C | 12 | 143 | 4910 | 43.97 | 425 | 422 | 102.1 |
| C | 9 | 54 | 4188 | 36.9 | 425 | 422 | 102.1 |
| D | 1 | 52 | 45301 | 440.68 | 430 | 413 | 101.9 |
| D | 2 | 234 | 34375 | 333.42 | 430 | 413 | 101.9 |
| D | 13 | 172 | 29070 | 281.34 | 430 | 413 | 101.9 |
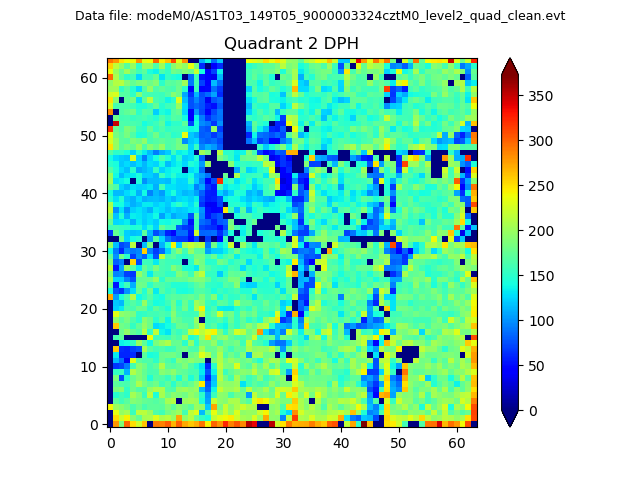
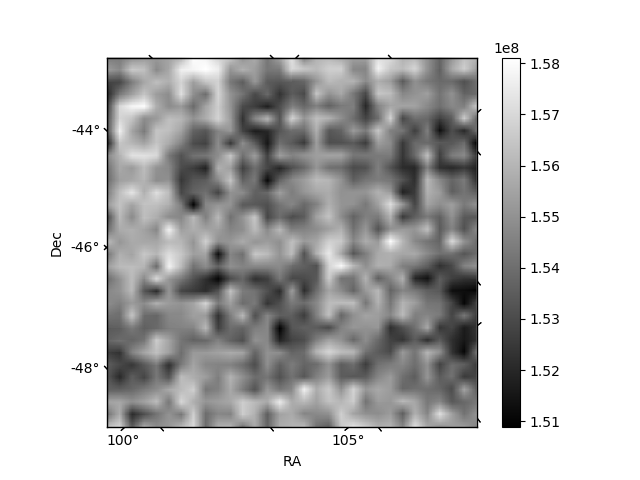
Histogram calculated using DETX and DETY for each event in the final _common_clean file
| Quadrant A |  |
 |
Quadrant B |
|---|---|---|---|
| Quadrant D |  |
 |
Quadrant C |
| Plot type | Count rate plots | Images |
|---|---|---|
| Comparison with Poisson distribution Blue bars denote a histogram of data divided into 1 sec bins. Red curve is a Poisson curve with rate = median count rate of data. |
 |
 |
| Quadrant-wise count rates Data is divided into 100 sec bins |
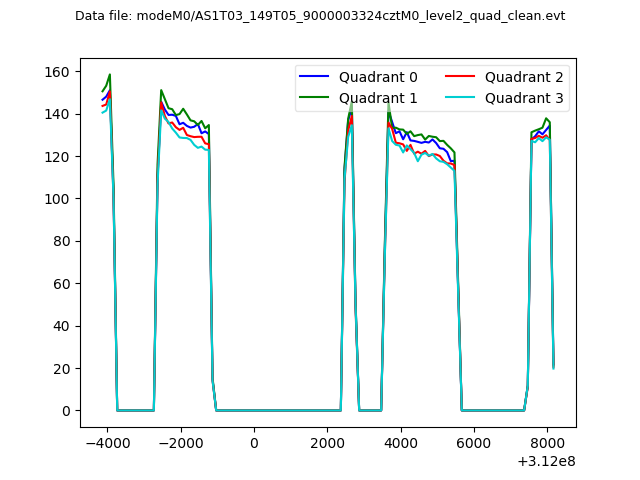 |
|
| Module-wise count rates for Quadrant A Data is divided into 100 sec bins |
 |
 |
| Module-wise count rates for Quadrant B Data is divided into 100 sec bins |
 |
 |
| Module-wise count rates for Quadrant C Data is divided into 100 sec bins |
 |
 |
| Module-wise count rates for Quadrant D Data is divided into 100 sec bins |
 |
 |
| Parameter | Plot |
|---|---|
| CZT HV Monitor | 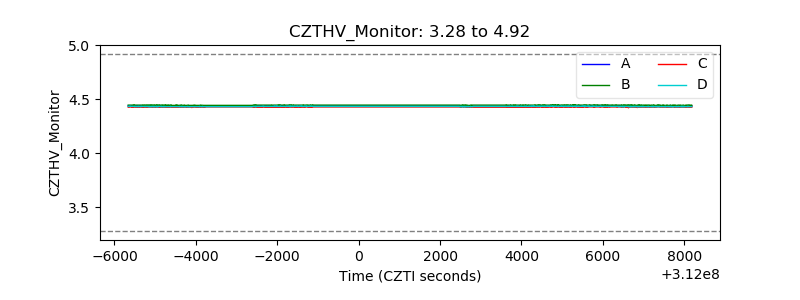 |
| D_VDD |  |
| Temperature 1 |  |
| Veto HV Monitor |  |
| Veto LLD | 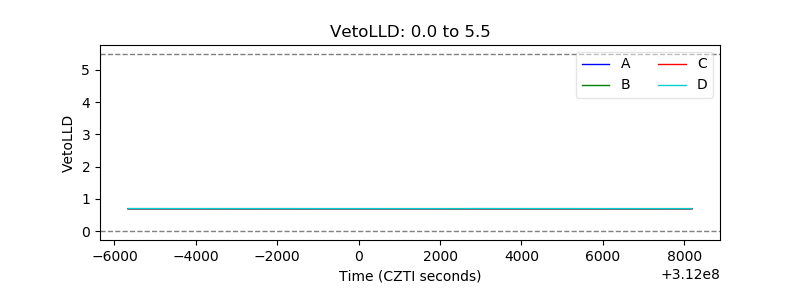 |
| Alpha Counter | 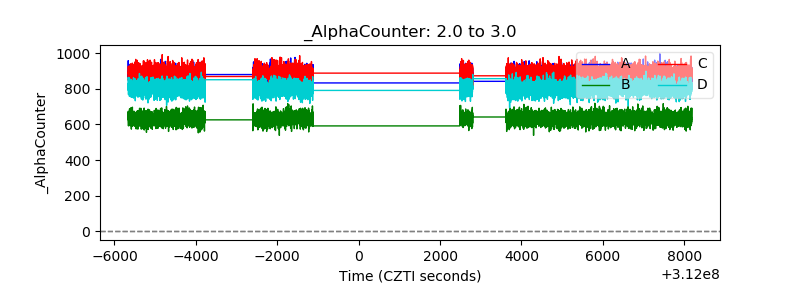 |
| _CPM_Rate |  |
| CZT Counter |  |
| +2.5 Volts monitor | 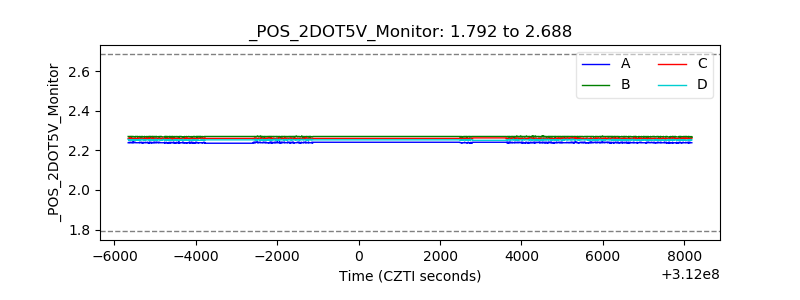 |
| +5 Volts monitor |  |
| _ROLL_ROT |  |
| _Roll_DEC |  |
| _Roll_RA |  |
| Veto Counter |  |