| Param | Original file | Final file |
|---|---|---|
| Filename | modeM0/AS1A07_056T01_9000003330cztM0_level2_bc.evt | modeM0/AS1A07_056T01_9000003330cztM0_level2_quad_clean.evt |
| Size (bytes) | 2,973,695,040 | 1,611,354,240 |
| Size | 2.8 GB | 1.5 GB |
| Events in quadrant A | 17,365,849 | 10,923,106 |
| Events in quadrant B | 25,604,805 | 11,030,247 |
| Events in quadrant C | 17,778,803 | 10,695,960 |
| Events in quadrant D | 23,588,702 | 10,407,989 |
| Mode SS | |||
|---|---|---|---|
| Quadrant | BADHDUFLAG | Total packets | Discarded packets |
| A | 0 | 1706 | 0 |
| B | 0 | 1706 | 0 |
| C | 0 | 1706 | 0 |
| D | 0 | 1706 | 0 |
| Mode M9 | |||
|---|---|---|---|
| Quadrant | BADHDUFLAG | Total packets | Discarded packets |
| A | 0 | 146 | 0 |
| B | 0 | 146 | 0 |
| C | 0 | 146 | 0 |
| D | 0 | 146 | 0 |
| Mode M0 | |||
|---|---|---|---|
| Quadrant | BADHDUFLAG | Total packets | Discarded packets |
| A | 0 | 173072 | 0 |
| B | 0 | 201875 | 0 |
| C | 0 | 177081 | 0 |
| D | 0 | 193228 | 0 |
| Quadrant | Total seconds | Saturated seconds | Saturation percentage |
|---|---|---|---|
| A | 83970 | 674 | 0.802668% |
| B | 83970 | 2794 | 3.327379% |
| C | 83970 | 1321 | 1.573181% |
| D | 83970 | 1584 | 1.886388% |
Noise dominated data is calculated using 1-second bins in cleaned event files. If a bin has >2000 counts, and if more than 50% of those come from <1% of pixels, then it is considered to be noise-dominated and hence unusable.
| Quadrant | # 1 sec bins | Bins with >0 counts | Bins with >2000 counts | High rate bins dominated by noise | Noise dominated (total time) | Noise dominated (detector-on time) | Marked lightcurve |
|---|---|---|---|---|---|---|---|
| A | 104472 | 83969 | 0 | 0 | 0.00% | 0.00% |  |
| B | 104472 | 83965 | 466 | 466 | 0.45% | 0.55% |  |
| C | 104472 | 83964 | 9 | 9 | 0.01% | 0.01% |  |
| D | 104472 | 83967 | 293 | 293 | 0.28% | 0.35% |  |
Top three noisy pixels from each quadrant. If the there are fewer than three noisy pixels in the level2.evt file, extra rows are filled as -1
| Pixel properties | Quadrant properties | ||||||
|---|---|---|---|---|---|---|---|
| Quadrant | DetID | PixID | Counts | Sigma | Mean | Median | Sigma |
| A | 3 | 1 | 212629 | 219.8 | 4379 | 4311 | 947.8 |
| A | 6 | 240 | 125925 | 128.32 | 4379 | 4311 | 947.8 |
| A | 13 | 254 | 113544 | 115.25 | 4379 | 4311 | 947.8 |
| B | 10 | 245 | 8010995 | 9607.45 | 4412 | 4307 | 833.4 |
| B | 0 | 190 | 136877 | 159.07 | 4412 | 4307 | 833.4 |
| B | 5 | 172 | 110597 | 127.54 | 4412 | 4307 | 833.4 |
| C | 10 | 22 | 521267 | 515.01 | 4266 | 4248 | 1003.9 |
| C | 0 | 239 | 454236 | 448.24 | 4266 | 4248 | 1003.9 |
| C | 3 | 9 | 192313 | 187.33 | 4266 | 4248 | 1003.9 |
| D | 1 | 52 | 4480861 | 4398.5 | 4327 | 4175 | 1017.8 |
| D | 7 | 223 | 1295244 | 1268.52 | 4327 | 4175 | 1017.8 |
| D | 2 | 234 | 335289 | 325.33 | 4327 | 4175 | 1017.8 |
Histogram calculated using DETX and DETY for each event in the final _common_clean file
| Quadrant A |  |
 |
Quadrant B |
|---|---|---|---|
| Quadrant D |  |
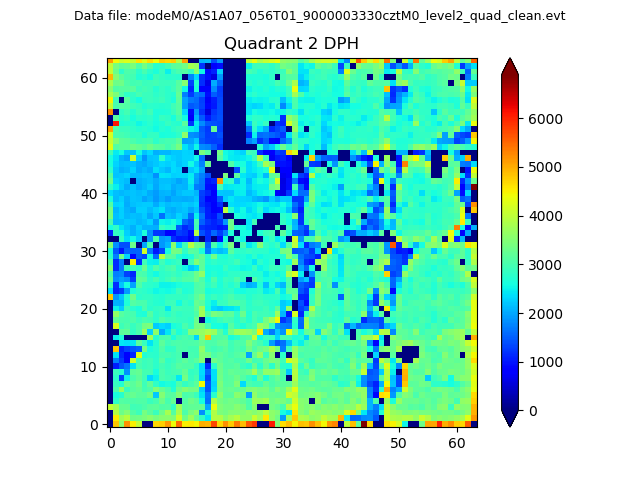 |
Quadrant C |
| Plot type | Count rate plots | Images |
|---|---|---|
| Comparison with Poisson distribution Blue bars denote a histogram of data divided into 1 sec bins. Red curve is a Poisson curve with rate = median count rate of data. |
 |
 |
| Quadrant-wise count rates Data is divided into 100 sec bins |
 |
|
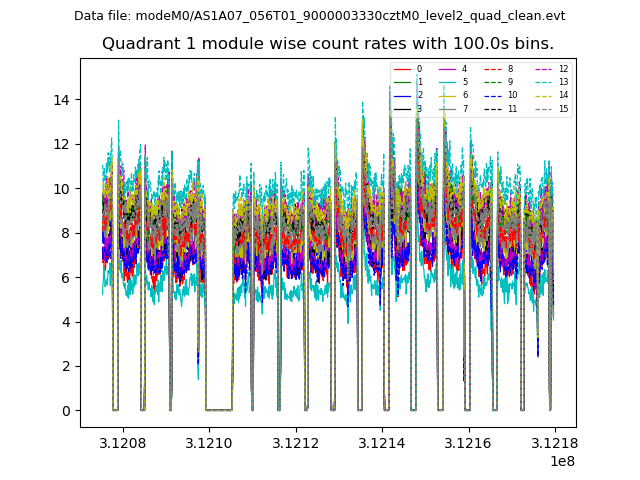
| Module-wise count rates for Quadrant A Data is divided into 100 sec bins |
 |
 |
| Module-wise count rates for Quadrant B Data is divided into 100 sec bins |
 |
 |
| Module-wise count rates for Quadrant C Data is divided into 100 sec bins |
 |
 |
| Module-wise count rates for Quadrant D Data is divided into 100 sec bins |
 |
 |
| Parameter | Plot |
|---|---|
| CZT HV Monitor |  |
| D_VDD |  |
| Temperature 1 | 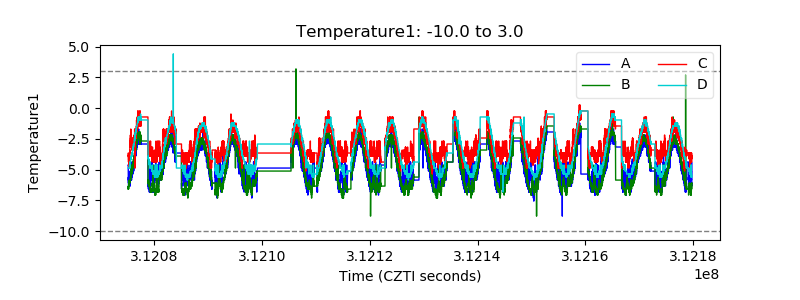 |
| Veto HV Monitor |  |
| Veto LLD |  |
| Alpha Counter |  |
| _CPM_Rate |  |
| CZT Counter |  |
| +2.5 Volts monitor |  |
| +5 Volts monitor |  |
| _ROLL_ROT |  |
| _Roll_DEC |  |
| _Roll_RA |  |
| Veto Counter |  |