| Param | Original file | Final file |
|---|---|---|
| Filename | modeM0/AS1T03_149T02_9000003316cztM0_level2_bc.evt | modeM0/AS1T03_149T02_9000003316cztM0_level2_quad_clean.evt |
| Size (bytes) | 190,650,240 | 73,736,640 |
| Size | 181.8 MB | 70.3 MB |
| Events in quadrant A | 1,089,734 | 468,859 |
| Events in quadrant B | 1,194,936 | 476,216 |
| Events in quadrant C | 1,054,804 | 452,754 |
| Events in quadrant D | 2,039,150 | 437,525 |
| Mode M9 | |||
|---|---|---|---|
| Quadrant | BADHDUFLAG | Total packets | Discarded packets |
| A | 0 | 3 | 0 |
| B | 0 | 3 | 0 |
| C | 0 | 3 | 0 |
| D | 0 | 3 | 0 |
| Mode SS | |||
|---|---|---|---|
| Quadrant | BADHDUFLAG | Total packets | Discarded packets |
| A | 0 | 114 | 0 |
| B | 0 | 114 | 0 |
| C | 0 | 114 | 0 |
| D | 0 | 114 | 0 |
| Mode M0 | |||
|---|---|---|---|
| Quadrant | BADHDUFLAG | Total packets | Discarded packets |
| A | 0 | 11569 | 0 |
| B | 0 | 11851 | 0 |
| C | 0 | 11584 | 0 |
| D | 0 | 14178 | 0 |
| Quadrant | Total seconds | Saturated seconds | Saturation percentage |
|---|---|---|---|
| A | 5682 | 47 | 0.827174% |
| B | 5682 | 70 | 1.231961% |
| C | 5682 | 58 | 1.020767% |
| D | 5682 | 166 | 2.921507% |
Noise dominated data is calculated using 1-second bins in cleaned event files. If a bin has >2000 counts, and if more than 50% of those come from <1% of pixels, then it is considered to be noise-dominated and hence unusable.
| Quadrant | # 1 sec bins | Bins with >0 counts | Bins with >2000 counts | High rate bins dominated by noise | Noise dominated (total time) | Noise dominated (detector-on time) | Marked lightcurve |
|---|---|---|---|---|---|---|---|
| A | 5680 | 5680 | 0 | 0 | 0.00% | 0.00% |  |
| B | 5681 | 5681 | 4 | 4 | 0.07% | 0.07% | 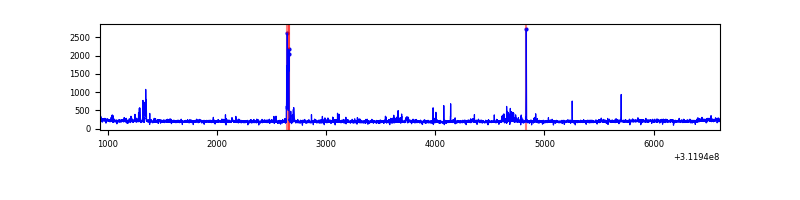 |
| C | 5681 | 5681 | 0 | 0 | 0.00% | 0.00% |  |
| D | 5680 | 5680 | 98 | 98 | 1.73% | 1.73% |  |
Top three noisy pixels from each quadrant. If the there are fewer than three noisy pixels in the level2.evt file, extra rows are filled as -1
| Pixel properties | Quadrant properties | ||||||
|---|---|---|---|---|---|---|---|
| Quadrant | DetID | PixID | Counts | Sigma | Mean | Median | Sigma |
| A | 13 | 254 | 7594 | 113.93 | 281 | 273 | 64.3 |
| A | 8 | 255 | 2111 | 28.6 | 281 | 273 | 64.3 |
| A | 12 | 194 | 1789 | 23.59 | 281 | 273 | 64.3 |
| B | 3 | 64 | 45240 | 789.13 | 284 | 276 | 57.0 |
| B | 0 | 197 | 16405 | 283.07 | 284 | 276 | 57.0 |
| B | 4 | 173 | 14079 | 242.25 | 284 | 276 | 57.0 |
| C | 1 | 16 | 3647 | 50.14 | 273 | 269 | 67.4 |
| C | 13 | 61 | 1521 | 18.58 | 273 | 269 | 67.4 |
| C | 10 | 22 | 1280 | 15.0 | 273 | 269 | 67.4 |
| D | 1 | 52 | 889082 | 13587.51 | 276 | 265 | 65.4 |
| D | 9 | 85 | 32788 | 497.19 | 276 | 265 | 65.4 |
| D | 2 | 234 | 23604 | 356.79 | 276 | 265 | 65.4 |
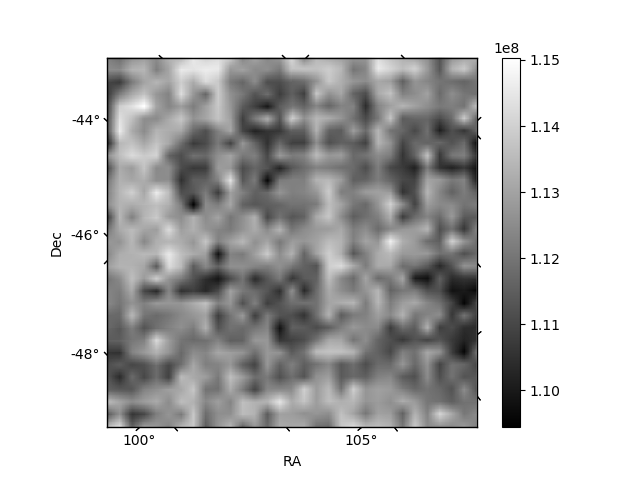
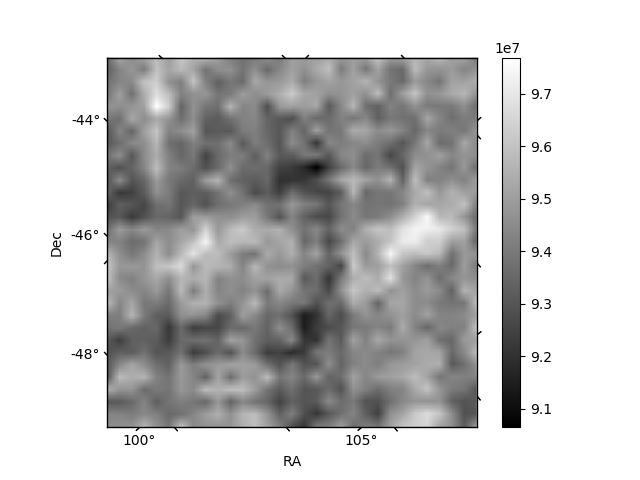
Histogram calculated using DETX and DETY for each event in the final _common_clean file
| Quadrant A |  |
 |
Quadrant B |
|---|---|---|---|
| Quadrant D |  |
 |
Quadrant C |
| Plot type | Count rate plots | Images |
|---|---|---|
| Comparison with Poisson distribution Blue bars denote a histogram of data divided into 1 sec bins. Red curve is a Poisson curve with rate = median count rate of data. |
 |
 |
| Quadrant-wise count rates Data is divided into 100 sec bins |
 |
|
| Module-wise count rates for Quadrant A Data is divided into 100 sec bins |
 |
 |
| Module-wise count rates for Quadrant B Data is divided into 100 sec bins |
 |
 |
| Module-wise count rates for Quadrant C Data is divided into 100 sec bins |
 |
 |
| Module-wise count rates for Quadrant D Data is divided into 100 sec bins |
 |
 |
| Parameter | Plot |
|---|---|
| CZT HV Monitor |  |
| D_VDD |  |
| Temperature 1 |  |
| Veto HV Monitor |  |
| Veto LLD | 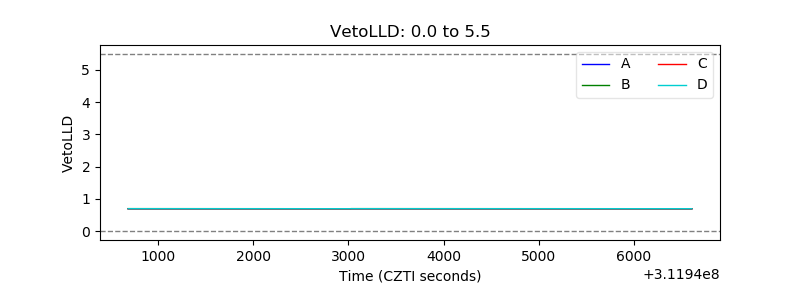 |
| Alpha Counter |  |
| _CPM_Rate |  |
| CZT Counter | 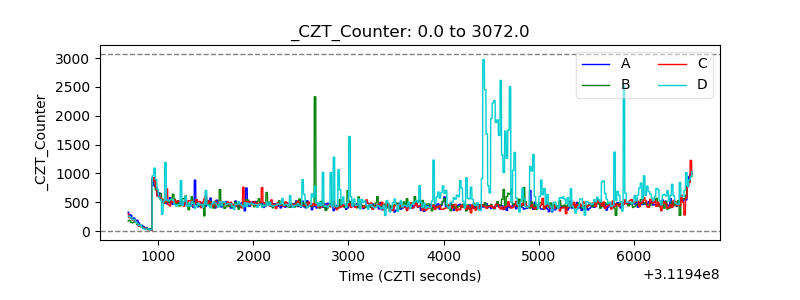 |
| +2.5 Volts monitor |  |
| +5 Volts monitor |  |
| _ROLL_ROT | 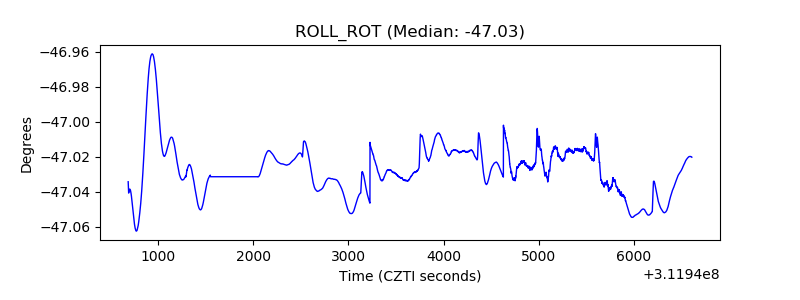 |
| _Roll_DEC | 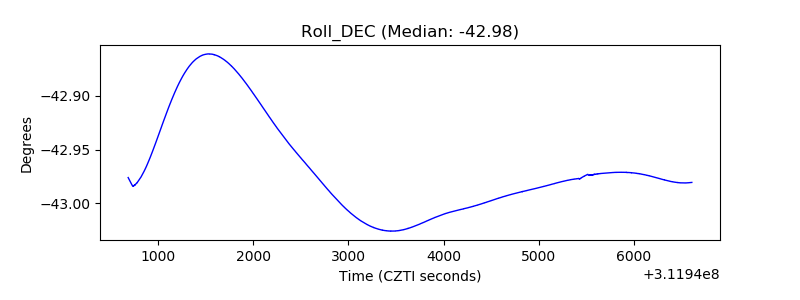 |
| _Roll_RA |  |
| Veto Counter |  |