| Param | Original file | Final file |
|---|---|---|
| Filename | modeM0/AS1T03_149T01_9000003314cztM0_level2_bc.evt | modeM0/AS1T03_149T01_9000003314cztM0_level2_quad_clean.evt |
| Size (bytes) | 171,552,960 | 59,054,400 |
| Size | 163.6 MB | 56.3 MB |
| Events in quadrant A | 981,622 | 363,260 |
| Events in quadrant B | 1,080,550 | 367,179 |
| Events in quadrant C | 955,299 | 351,189 |
| Events in quadrant D | 1,816,014 | 342,220 |
| Mode M0 | |||
|---|---|---|---|
| Quadrant | BADHDUFLAG | Total packets | Discarded packets |
| A | 0 | 10408 | 0 |
| B | 0 | 10662 | 0 |
| C | 0 | 10410 | 0 |
| D | 0 | 12765 | 0 |
| Mode SS | |||
|---|---|---|---|
| Quadrant | BADHDUFLAG | Total packets | Discarded packets |
| A | 0 | 104 | 0 |
| B | 0 | 104 | 0 |
| C | 0 | 104 | 0 |
| D | 0 | 104 | 0 |
| Quadrant | Total seconds | Saturated seconds | Saturation percentage |
|---|---|---|---|
| A | 5196 | 2 | 0.038491% |
| B | 5196 | 5 | 0.096228% |
| C | 5196 | 14 | 0.269438% |
| D | 5196 | 88 | 1.693610% |
Noise dominated data is calculated using 1-second bins in cleaned event files. If a bin has >2000 counts, and if more than 50% of those come from <1% of pixels, then it is considered to be noise-dominated and hence unusable.
| Quadrant | # 1 sec bins | Bins with >0 counts | Bins with >2000 counts | High rate bins dominated by noise | Noise dominated (total time) | Noise dominated (detector-on time) | Marked lightcurve |
|---|---|---|---|---|---|---|---|
| A | 5196 | 5196 | 0 | 0 | 0.00% | 0.00% |  |
| B | 5196 | 5196 | 0 | 0 | 0.00% | 0.00% |  |
| C | 5196 | 5196 | 0 | 0 | 0.00% | 0.00% |  |
| D | 5196 | 5196 | 24 | 24 | 0.46% | 0.46% |  |
Top three noisy pixels from each quadrant. If the there are fewer than three noisy pixels in the level2.evt file, extra rows are filled as -1
| Pixel properties | Quadrant properties | ||||||
|---|---|---|---|---|---|---|---|
| Quadrant | DetID | PixID | Counts | Sigma | Mean | Median | Sigma |
| A | 13 | 254 | 7802 | 130.13 | 253 | 247 | 58.1 |
| A | 3 | 1 | 2200 | 33.64 | 253 | 247 | 58.1 |
| A | 0 | 226 | 1608 | 23.44 | 253 | 247 | 58.1 |
| B | 15 | 33 | 43644 | 836.78 | 258 | 251 | 51.9 |
| B | 3 | 64 | 14839 | 281.31 | 258 | 251 | 51.9 |
| B | 0 | 197 | 11993 | 226.43 | 258 | 251 | 51.9 |
| C | 10 | 22 | 4127 | 62.99 | 247 | 244 | 61.6 |
| C | 13 | 61 | 1349 | 17.93 | 247 | 244 | 61.6 |
| C | 1 | 16 | 787 | 8.81 | 247 | 244 | 61.6 |
| D | 1 | 52 | 562472 | 9210.72 | 250 | 241 | 61.0 |
| D | 7 | 223 | 161117 | 2635.54 | 250 | 241 | 61.0 |
| D | 13 | 104 | 67323 | 1098.97 | 250 | 241 | 61.0 |
Histogram calculated using DETX and DETY for each event in the final _common_clean file
| Quadrant A |  |
 |
Quadrant B |
|---|---|---|---|
| Quadrant D |  |
 |
Quadrant C |
| Plot type | Count rate plots | Images |
|---|---|---|
| Comparison with Poisson distribution Blue bars denote a histogram of data divided into 1 sec bins. Red curve is a Poisson curve with rate = median count rate of data. |
 |
 |
| Quadrant-wise count rates Data is divided into 100 sec bins |
 |
|
| Module-wise count rates for Quadrant A Data is divided into 100 sec bins |
 |
 |
| Module-wise count rates for Quadrant B Data is divided into 100 sec bins |
 |
 |
| Module-wise count rates for Quadrant C Data is divided into 100 sec bins |
 |
 |
| Module-wise count rates for Quadrant D Data is divided into 100 sec bins |
 |
 |
| Parameter | Plot |
|---|---|
| CZT HV Monitor |  |
| D_VDD |  |
| Temperature 1 |  |
| Veto HV Monitor |  |
| Veto LLD |  |
| Alpha Counter |  |
| _CPM_Rate |  |
| CZT Counter |  |
| +2.5 Volts monitor |  |
| +5 Volts monitor | 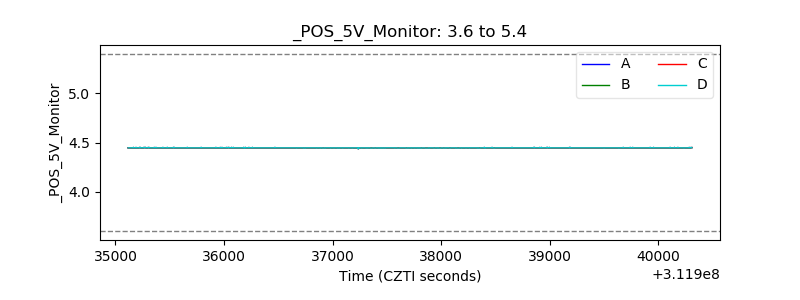 |
| _ROLL_ROT | 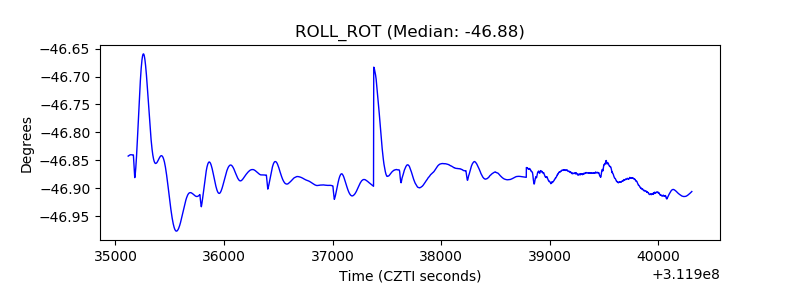 |
| _Roll_DEC |  |
| _Roll_RA |  |
| Veto Counter |  |