| Param | Original file | Final file |
|---|---|---|
| Filename | modeM0/AS1A07_007T03_9000003320cztM0_level2_bc.evt | modeM0/AS1A07_007T03_9000003320cztM0_level2_quad_clean.evt |
| Size (bytes) | 926,049,600 | 374,667,840 |
| Size | 883.1 MB | 357.3 MB |
| Events in quadrant A | 5,668,915 | 2,453,716 |
| Events in quadrant B | 5,956,054 | 2,478,932 |
| Events in quadrant C | 5,612,186 | 2,371,681 |
| Events in quadrant D | 9,027,156 | 2,252,036 |
| Mode SS | |||
|---|---|---|---|
| Quadrant | BADHDUFLAG | Total packets | Discarded packets |
| A | 0 | 530 | 0 |
| B | 0 | 530 | 0 |
| C | 0 | 530 | 0 |
| D | 0 | 530 | 0 |
| Mode M9 | |||
|---|---|---|---|
| Quadrant | BADHDUFLAG | Total packets | Discarded packets |
| A | 0 | 60 | 0 |
| B | 0 | 60 | 0 |
| C | 0 | 60 | 0 |
| D | 0 | 60 | 0 |
| Mode M0 | |||
|---|---|---|---|
| Quadrant | BADHDUFLAG | Total packets | Discarded packets |
| A | 0 | 54416 | 0 |
| B | 0 | 55507 | 0 |
| C | 0 | 55163 | 0 |
| D | 0 | 65449 | 0 |
| Quadrant | Total seconds | Saturated seconds | Saturation percentage |
|---|---|---|---|
| A | 26062 | 207 | 0.794260% |
| B | 26062 | 223 | 0.855652% |
| C | 26062 | 411 | 1.577009% |
| D | 26062 | 902 | 3.460978% |
Noise dominated data is calculated using 1-second bins in cleaned event files. If a bin has >2000 counts, and if more than 50% of those come from <1% of pixels, then it is considered to be noise-dominated and hence unusable.
| Quadrant | # 1 sec bins | Bins with >0 counts | Bins with >2000 counts | High rate bins dominated by noise | Noise dominated (total time) | Noise dominated (detector-on time) | Marked lightcurve |
|---|---|---|---|---|---|---|---|
| A | 32037 | 26060 | 0 | 0 | 0.00% | 0.00% |  |
| B | 32037 | 26062 | 1 | 1 | 0.00% | 0.00% |  |
| C | 32037 | 26059 | 1 | 1 | 0.00% | 0.00% |  |
| D | 32037 | 26061 | 176 | 176 | 0.55% | 0.68% | 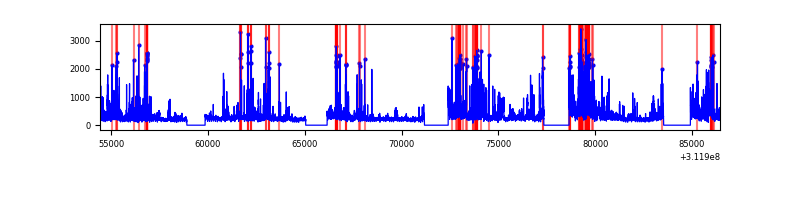 |
Top three noisy pixels from each quadrant. If the there are fewer than three noisy pixels in the level2.evt file, extra rows are filled as -1
| Pixel properties | Quadrant properties | ||||||
|---|---|---|---|---|---|---|---|
| Quadrant | DetID | PixID | Counts | Sigma | Mean | Median | Sigma |
| A | 13 | 254 | 37033 | 113.4 | 1459 | 1437 | 313.9 |
| A | 3 | 1 | 21965 | 65.4 | 1459 | 1437 | 313.9 |
| A | 15 | 174 | 16463 | 47.87 | 1459 | 1437 | 313.9 |
| B | 3 | 64 | 93534 | 338.49 | 1470 | 1438 | 272.1 |
| B | 0 | 190 | 70384 | 253.41 | 1470 | 1438 | 272.1 |
| B | 0 | 228 | 36598 | 129.23 | 1470 | 1438 | 272.1 |
| C | 1 | 16 | 84417 | 250.32 | 1410 | 1407 | 331.6 |
| C | 0 | 10 | 67389 | 198.97 | 1410 | 1407 | 331.6 |
| C | 9 | 54 | 23874 | 67.75 | 1410 | 1407 | 331.6 |
| D | 1 | 52 | 2156846 | 6581.03 | 1417 | 1373 | 327.5 |
| D | 13 | 249 | 603838 | 1839.43 | 1417 | 1373 | 327.5 |
| D | 13 | 172 | 389459 | 1184.89 | 1417 | 1373 | 327.5 |
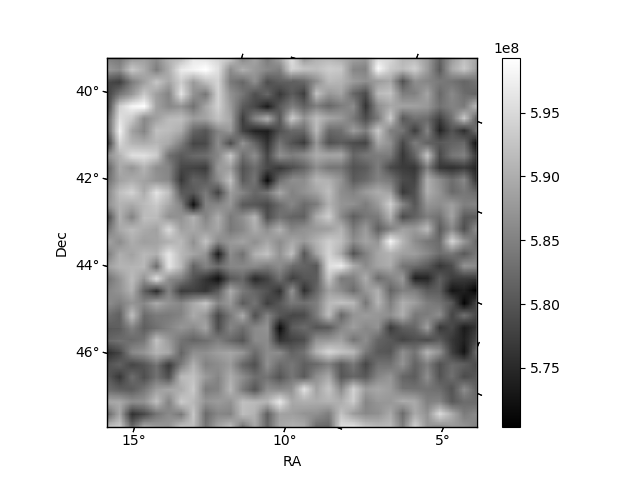
Histogram calculated using DETX and DETY for each event in the final _common_clean file
| Quadrant A |  |
 |
Quadrant B |
|---|---|---|---|
| Quadrant D |  |
 |
Quadrant C |
| Plot type | Count rate plots | Images |
|---|---|---|
| Comparison with Poisson distribution Blue bars denote a histogram of data divided into 1 sec bins. Red curve is a Poisson curve with rate = median count rate of data. |
 |
 |
| Quadrant-wise count rates Data is divided into 100 sec bins |
 |
|
| Module-wise count rates for Quadrant A Data is divided into 100 sec bins |
 |
 |
| Module-wise count rates for Quadrant B Data is divided into 100 sec bins |
 |
 |
| Module-wise count rates for Quadrant C Data is divided into 100 sec bins |
 |
 |
| Module-wise count rates for Quadrant D Data is divided into 100 sec bins |
 |
 |
| Parameter | Plot |
|---|---|
| CZT HV Monitor |  |
| D_VDD |  |
| Temperature 1 |  |
| Veto HV Monitor | 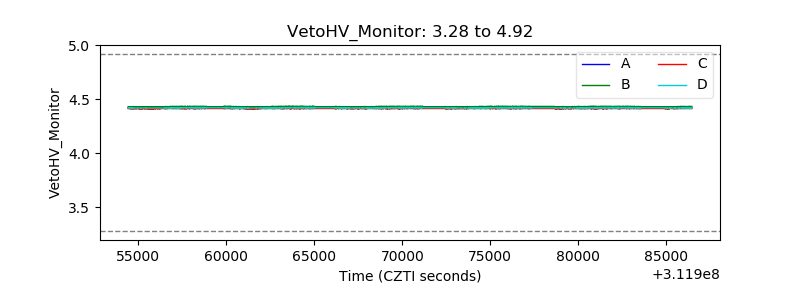 |
| Veto LLD |  |
| Alpha Counter |  |
| _CPM_Rate |  |
| CZT Counter |  |
| +2.5 Volts monitor |  |
| +5 Volts monitor |  |
| _ROLL_ROT | 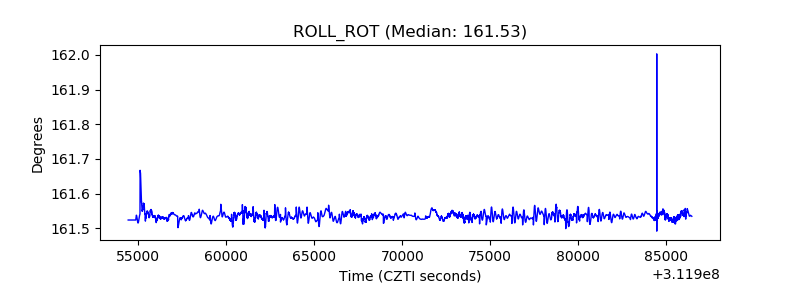 |
| _Roll_DEC | 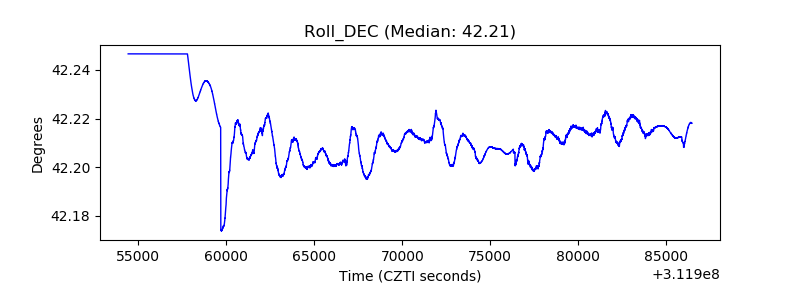 |
| _Roll_RA |  |
| Veto Counter |  |