| Param | Original file | Final file |
|---|---|---|
| Filename | modeM0/AS1T03_156T01_9000003312cztM0_level2_bc.evt | modeM0/AS1T03_156T01_9000003312cztM0_level2_quad_clean.evt |
| Size (bytes) | 1,442,684,160 | 581,322,240 |
| Size | 1.3 GB | 554.4 MB |
| Events in quadrant A | 9,324,042 | 3,705,646 |
| Events in quadrant B | 9,823,449 | 3,768,293 |
| Events in quadrant C | 9,112,589 | 3,602,097 |
| Events in quadrant D | 12,402,961 | 3,485,749 |
| Mode M9 | |||
|---|---|---|---|
| Quadrant | BADHDUFLAG | Total packets | Discarded packets |
| A | 0 | 81 | 0 |
| B | 0 | 81 | 0 |
| C | 0 | 81 | 0 |
| D | 0 | 81 | 0 |
| Mode SS | |||
|---|---|---|---|
| Quadrant | BADHDUFLAG | Total packets | Discarded packets |
| A | 0 | 910 | 0 |
| B | 0 | 910 | 0 |
| C | 0 | 910 | 0 |
| D | 0 | 910 | 0 |
| Mode M0 | |||
|---|---|---|---|
| Quadrant | BADHDUFLAG | Total packets | Discarded packets |
| A | 0 | 91635 | 0 |
| B | 0 | 93264 | 0 |
| C | 0 | 92286 | 0 |
| D | 0 | 100169 | 0 |
| Quadrant | Total seconds | Saturated seconds | Saturation percentage |
|---|---|---|---|
| A | 44361 | 369 | 0.831812% |
| B | 44361 | 544 | 1.226302% |
| C | 44361 | 625 | 1.408895% |
| D | 44361 | 484 | 1.091048% |
Noise dominated data is calculated using 1-second bins in cleaned event files. If a bin has >2000 counts, and if more than 50% of those come from <1% of pixels, then it is considered to be noise-dominated and hence unusable.
| Quadrant | # 1 sec bins | Bins with >0 counts | Bins with >2000 counts | High rate bins dominated by noise | Noise dominated (total time) | Noise dominated (detector-on time) | Marked lightcurve |
|---|---|---|---|---|---|---|---|
| A | 52666 | 44360 | 0 | 0 | 0.00% | 0.00% |  |
| B | 52666 | 44358 | 4 | 4 | 0.01% | 0.01% |  |
| C | 52666 | 44361 | 1 | 1 | 0.00% | 0.00% |  |
| D | 52666 | 44362 | 59 | 59 | 0.11% | 0.13% | 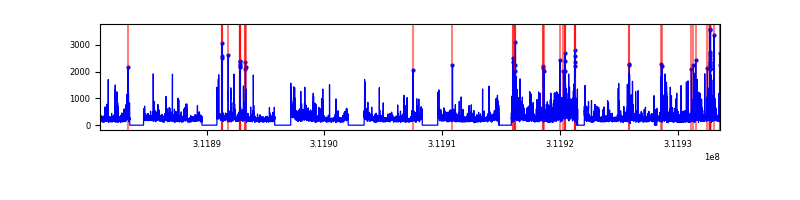 |
Top three noisy pixels from each quadrant. If the there are fewer than three noisy pixels in the level2.evt file, extra rows are filled as -1
| Pixel properties | Quadrant properties | ||||||
|---|---|---|---|---|---|---|---|
| Quadrant | DetID | PixID | Counts | Sigma | Mean | Median | Sigma |
| A | 13 | 254 | 61702 | 114.72 | 2407 | 2372 | 517.2 |
| A | 3 | 1 | 31951 | 57.2 | 2407 | 2372 | 517.2 |
| A | 0 | 226 | 15422 | 25.23 | 2407 | 2372 | 517.2 |
| B | 3 | 64 | 140044 | 304.94 | 2441 | 2387 | 451.4 |
| B | 0 | 190 | 102405 | 221.56 | 2441 | 2387 | 451.4 |
| B | 0 | 229 | 69059 | 147.69 | 2441 | 2387 | 451.4 |
| C | 10 | 22 | 62317 | 108.7 | 2343 | 2335 | 551.8 |
| C | 0 | 10 | 31705 | 53.23 | 2343 | 2335 | 551.8 |
| C | 13 | 61 | 13562 | 20.35 | 2343 | 2335 | 551.8 |
| D | 1 | 52 | 1532938 | 2785.83 | 2367 | 2288 | 549.4 |
| D | 12 | 227 | 646979 | 1173.36 | 2367 | 2288 | 549.4 |
| D | 7 | 223 | 537822 | 974.69 | 2367 | 2288 | 549.4 |
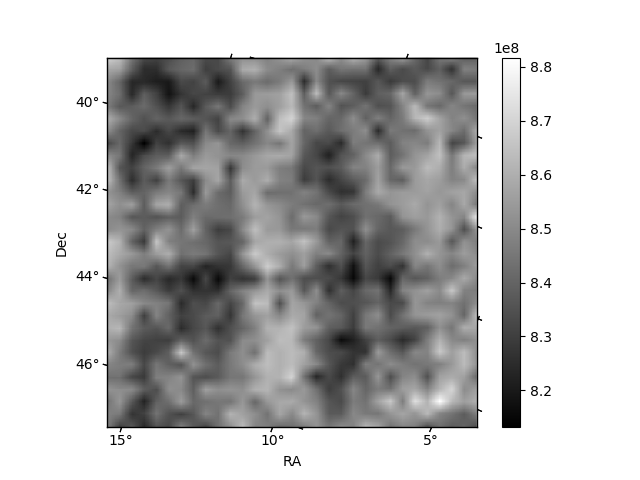
Histogram calculated using DETX and DETY for each event in the final _common_clean file
| Quadrant A |  |
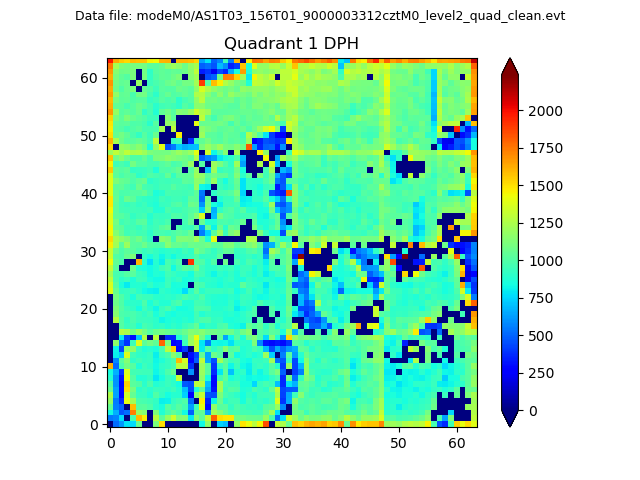 |
Quadrant B |
|---|---|---|---|
| Quadrant D |  |
 |
Quadrant C |
| Plot type | Count rate plots | Images |
|---|---|---|
| Comparison with Poisson distribution Blue bars denote a histogram of data divided into 1 sec bins. Red curve is a Poisson curve with rate = median count rate of data. |
 |
 |
| Quadrant-wise count rates Data is divided into 100 sec bins |
 |
|
| Module-wise count rates for Quadrant A Data is divided into 100 sec bins |
 |
 |
| Module-wise count rates for Quadrant B Data is divided into 100 sec bins |
 |
 |
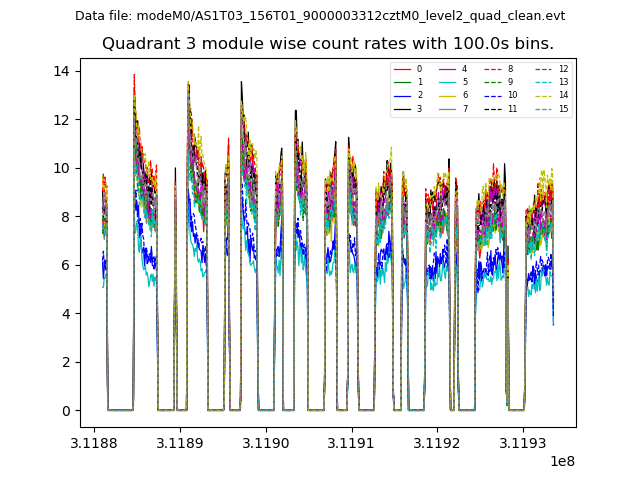
| Module-wise count rates for Quadrant C Data is divided into 100 sec bins |
 |
 |
| Module-wise count rates for Quadrant D Data is divided into 100 sec bins |
 |
 |
| Parameter | Plot |
|---|---|
| CZT HV Monitor |  |
| D_VDD | 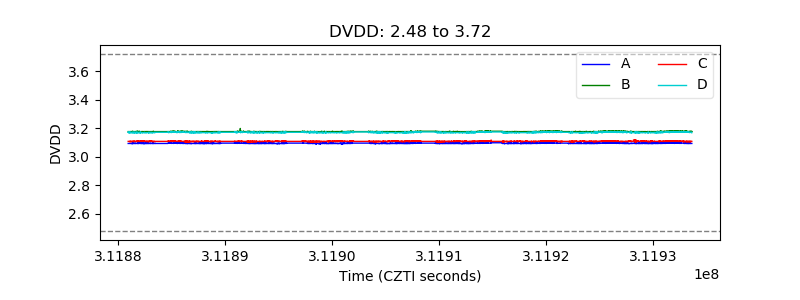 |
| Temperature 1 |  |
| Veto HV Monitor |  |
| Veto LLD |  |
| Alpha Counter |  |
| _CPM_Rate |  |
| CZT Counter |  |
| +2.5 Volts monitor |  |
| +5 Volts monitor |  |
| _ROLL_ROT |  |
| _Roll_DEC | 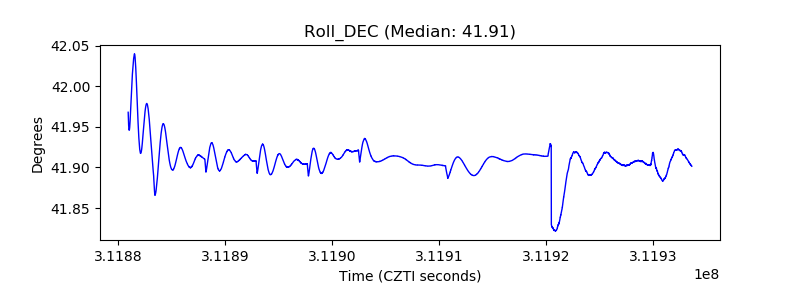 |
| _Roll_RA |  |
| Veto Counter |  |