| Param | Original file | Final file |
|---|---|---|
| Filename | modeM0/AS1C05_004T01_9000003308cztM0_level2_bc.evt | modeM0/AS1C05_004T01_9000003308cztM0_level2_quad_clean.evt |
| Size (bytes) | 1,194,860,160 | 536,008,320 |
| Size | 1.1 GB | 511.2 MB |
| Events in quadrant A | 7,488,294 | 3,518,691 |
| Events in quadrant B | 8,319,819 | 3,582,772 |
| Events in quadrant C | 7,000,787 | 3,424,612 |
| Events in quadrant D | 10,981,865 | 3,300,374 |
| Mode M0 | |||
|---|---|---|---|
| Quadrant | BADHDUFLAG | Total packets | Discarded packets |
| A | 0 | 72641 | 0 |
| B | 0 | 75143 | 0 |
| C | 0 | 72153 | 0 |
| D | 0 | 82858 | 0 |
| Mode SS | |||
|---|---|---|---|
| Quadrant | BADHDUFLAG | Total packets | Discarded packets |
| A | 0 | 716 | 0 |
| B | 0 | 716 | 0 |
| C | 0 | 716 | 0 |
| D | 0 | 716 | 0 |
| Mode M9 | |||
|---|---|---|---|
| Quadrant | BADHDUFLAG | Total packets | Discarded packets |
| A | 0 | 46 | 0 |
| B | 0 | 47 | 0 |
| C | 0 | 47 | 0 |
| D | 0 | 47 | 0 |
| Quadrant | Total seconds | Saturated seconds | Saturation percentage |
|---|---|---|---|
| A | 35072 | 466 | 1.328695% |
| B | 35072 | 646 | 1.841925% |
| C | 35072 | 597 | 1.702213% |
| D | 35072 | 669 | 1.907505% |
Noise dominated data is calculated using 1-second bins in cleaned event files. If a bin has >2000 counts, and if more than 50% of those come from <1% of pixels, then it is considered to be noise-dominated and hence unusable.
| Quadrant | # 1 sec bins | Bins with >0 counts | Bins with >2000 counts | High rate bins dominated by noise | Noise dominated (total time) | Noise dominated (detector-on time) | Marked lightcurve |
|---|---|---|---|---|---|---|---|
| A | 57028 | 35071 | 7 | 7 | 0.01% | 0.02% |  |
| B | 57028 | 35071 | 58 | 58 | 0.10% | 0.17% |  |
| C | 57028 | 35071 | 0 | 0 | 0.00% | 0.00% |  |
| D | 57028 | 35070 | 122 | 122 | 0.21% | 0.35% |  |
Top three noisy pixels from each quadrant. If the there are fewer than three noisy pixels in the level2.evt file, extra rows are filled as -1
| Pixel properties | Quadrant properties | ||||||
|---|---|---|---|---|---|---|---|
| Quadrant | DetID | PixID | Counts | Sigma | Mean | Median | Sigma |
| A | 3 | 1 | 284098 | 694.58 | 1854 | 1819 | 406.4 |
| A | 4 | 2 | 67622 | 161.92 | 1854 | 1819 | 406.4 |
| A | 13 | 254 | 44641 | 105.37 | 1854 | 1819 | 406.4 |
| B | 3 | 64 | 562928 | 1584.98 | 1885 | 1844 | 354.0 |
| B | 0 | 190 | 136689 | 380.92 | 1885 | 1844 | 354.0 |
| B | 0 | 229 | 119783 | 333.16 | 1885 | 1844 | 354.0 |
| C | 0 | 10 | 27319 | 59.44 | 1805 | 1799 | 429.4 |
| C | 3 | 9 | 21427 | 45.71 | 1805 | 1799 | 429.4 |
| C | 13 | 61 | 10478 | 20.21 | 1805 | 1799 | 429.4 |
| D | 1 | 52 | 2244099 | 5283.2 | 1819 | 1757 | 424.4 |
| D | 12 | 227 | 1340100 | 3153.28 | 1819 | 1757 | 424.4 |
| D | 2 | 234 | 138991 | 323.34 | 1819 | 1757 | 424.4 |
Histogram calculated using DETX and DETY for each event in the final _common_clean file
| Quadrant A |  |
 |
Quadrant B |
|---|---|---|---|
| Quadrant D | 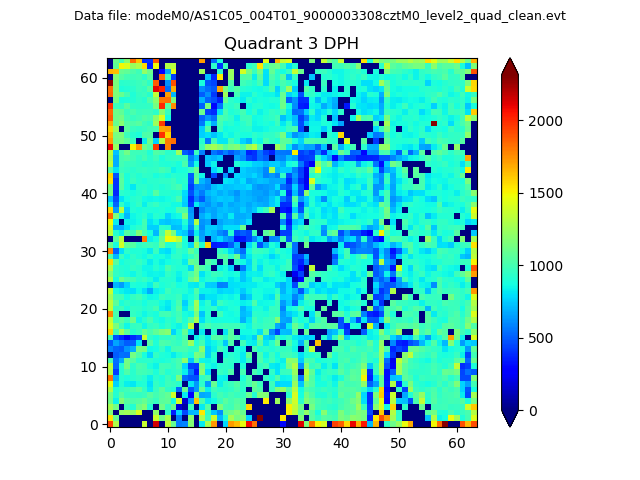 |
 |
Quadrant C |
| Plot type | Count rate plots | Images |
|---|---|---|
| Comparison with Poisson distribution Blue bars denote a histogram of data divided into 1 sec bins. Red curve is a Poisson curve with rate = median count rate of data. |
 |
 |
| Quadrant-wise count rates Data is divided into 100 sec bins |
 |
|
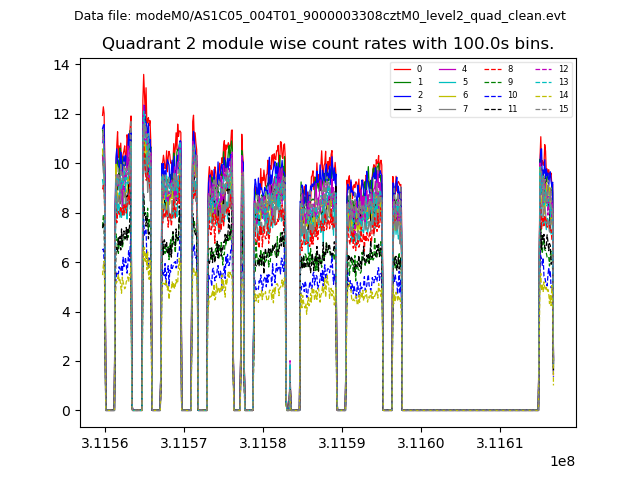
| Module-wise count rates for Quadrant A Data is divided into 100 sec bins |
 |
 |
| Module-wise count rates for Quadrant B Data is divided into 100 sec bins |
 |
 |
| Module-wise count rates for Quadrant C Data is divided into 100 sec bins |
 |
 |
| Module-wise count rates for Quadrant D Data is divided into 100 sec bins |
 |
 |
| Parameter | Plot |
|---|---|
| CZT HV Monitor |  |
| D_VDD |  |
| Temperature 1 |  |
| Veto HV Monitor |  |
| Veto LLD |  |
| Alpha Counter |  |
| _CPM_Rate |  |
| CZT Counter |  |
| +2.5 Volts monitor |  |
| +5 Volts monitor | 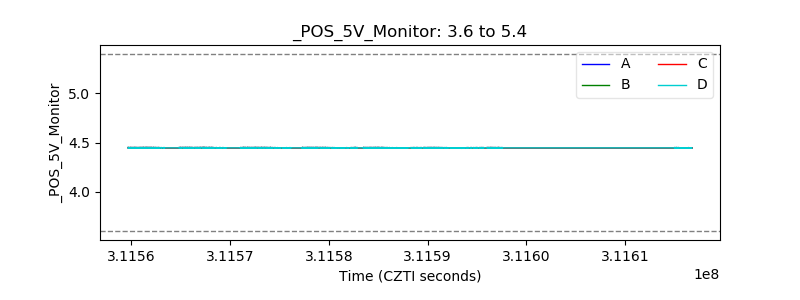 |
| _ROLL_ROT |  |
| _Roll_DEC |  |
| _Roll_RA |  |
| Veto Counter | 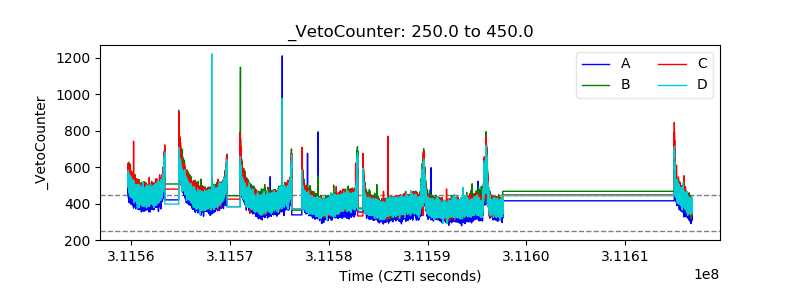 |