| Param | Original file | Final file |
|---|---|---|
| Filename | modeM0/AS1A07_007T04_9000003310cztM0_level2_bc.evt | modeM0/AS1A07_007T04_9000003310cztM0_level2_quad_clean.evt |
| Size (bytes) | 7,820,064,000 | 2,949,612,480 |
| Size | 7.3 GB | 2.7 GB |
| Events in quadrant A | 45,861,773 | 19,011,273 |
| Events in quadrant B | 49,119,248 | 19,239,627 |
| Events in quadrant C | 44,469,128 | 18,457,205 |
| Events in quadrant D | 82,222,898 | 17,388,627 |
| Mode M0 | |||
|---|---|---|---|
| Quadrant | BADHDUFLAG | Total packets | Discarded packets |
| A | 0 | 459019 | 0 |
| B | 0 | 469503 | 0 |
| C | 0 | 460523 | 0 |
| D | 0 | 574805 | 0 |
| Mode SS | |||
|---|---|---|---|
| Quadrant | BADHDUFLAG | Total packets | Discarded packets |
| A | 0 | 4536 | 0 |
| B | 0 | 4536 | 0 |
| C | 0 | 4536 | 0 |
| D | 0 | 4536 | 0 |
| Mode M9 | |||
|---|---|---|---|
| Quadrant | BADHDUFLAG | Total packets | Discarded packets |
| A | 0 | 357 | 0 |
| B | 0 | 358 | 0 |
| C | 0 | 358 | 0 |
| D | 0 | 358 | 0 |
| Quadrant | Total seconds | Saturated seconds | Saturation percentage |
|---|---|---|---|
| A | 222595 | 2508 | 1.126710% |
| B | 222595 | 3340 | 1.500483% |
| C | 222595 | 3608 | 1.620881% |
| D | 222595 | 11066 | 4.971361% |
Noise dominated data is calculated using 1-second bins in cleaned event files. If a bin has >2000 counts, and if more than 50% of those come from <1% of pixels, then it is considered to be noise-dominated and hence unusable.
| Quadrant | # 1 sec bins | Bins with >0 counts | Bins with >2000 counts | High rate bins dominated by noise | Noise dominated (total time) | Noise dominated (detector-on time) | Marked lightcurve |
|---|---|---|---|---|---|---|---|
| A | 263374 | 222582 | 0 | 0 | 0.00% | 0.00% |  |
| B | 263374 | 222577 | 128 | 128 | 0.05% | 0.06% |  |
| C | 263374 | 222583 | 3 | 3 | 0.00% | 0.00% | 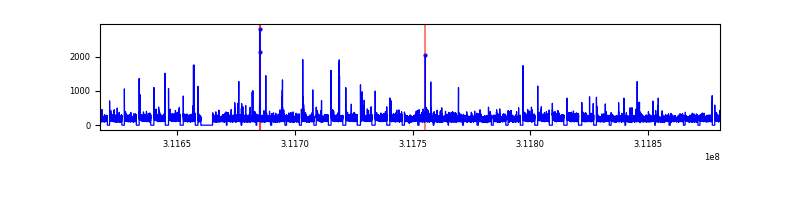 |
| D | 263374 | 222580 | 4320 | 4320 | 1.64% | 1.94% |  |
Top three noisy pixels from each quadrant. If the there are fewer than three noisy pixels in the level2.evt file, extra rows are filled as -1
| Pixel properties | Quadrant properties | ||||||
|---|---|---|---|---|---|---|---|
| Quadrant | DetID | PixID | Counts | Sigma | Mean | Median | Sigma |
| A | 3 | 1 | 304437 | 114.88 | 11784 | 11569 | 2549.2 |
| A | 13 | 254 | 299890 | 113.1 | 11784 | 11569 | 2549.2 |
| A | 0 | 226 | 75706 | 25.16 | 11784 | 11569 | 2549.2 |
| B | 3 | 64 | 1511844 | 679.9 | 11913 | 11630 | 2206.5 |
| B | 0 | 190 | 573950 | 254.85 | 11913 | 11630 | 2206.5 |
| B | 0 | 229 | 356943 | 156.5 | 11913 | 11630 | 2206.5 |
| C | 0 | 10 | 151279 | 51.67 | 11445 | 11384 | 2707.4 |
| C | 10 | 22 | 115847 | 38.58 | 11445 | 11384 | 2707.4 |
| C | 9 | 54 | 110720 | 36.69 | 11445 | 11384 | 2707.4 |
| D | 1 | 52 | 30635369 | 11559.11 | 11375 | 10991 | 2649.4 |
| D | 7 | 38 | 2249999 | 845.11 | 11375 | 10991 | 2649.4 |
| D | 12 | 227 | 2146870 | 806.18 | 11375 | 10991 | 2649.4 |
Histogram calculated using DETX and DETY for each event in the final _common_clean file
| Quadrant A | 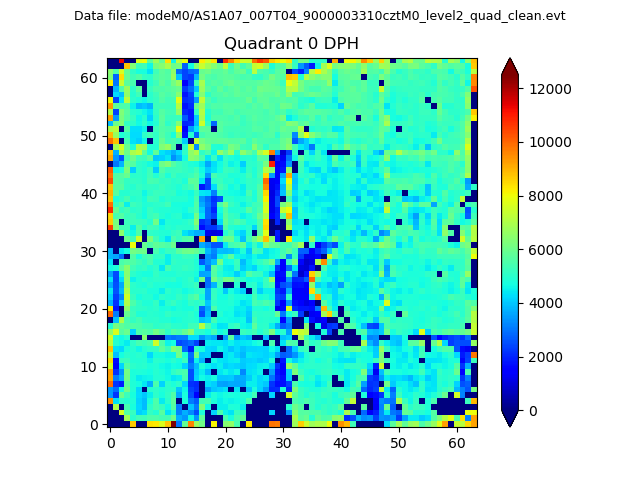 |
 |
Quadrant B |
|---|---|---|---|
| Quadrant D |  |
 |
Quadrant C |
| Plot type | Count rate plots | Images |
|---|---|---|
| Comparison with Poisson distribution Blue bars denote a histogram of data divided into 1 sec bins. Red curve is a Poisson curve with rate = median count rate of data. |
 |
 |
| Quadrant-wise count rates Data is divided into 100 sec bins |
 |
|
| Module-wise count rates for Quadrant A Data is divided into 100 sec bins |
 |
 |
| Module-wise count rates for Quadrant B Data is divided into 100 sec bins |
 |
 |
| Module-wise count rates for Quadrant C Data is divided into 100 sec bins |
 |
 |
| Module-wise count rates for Quadrant D Data is divided into 100 sec bins |
 |
 |
| Parameter | Plot |
|---|---|
| CZT HV Monitor |  |
| D_VDD |  |
| Temperature 1 | 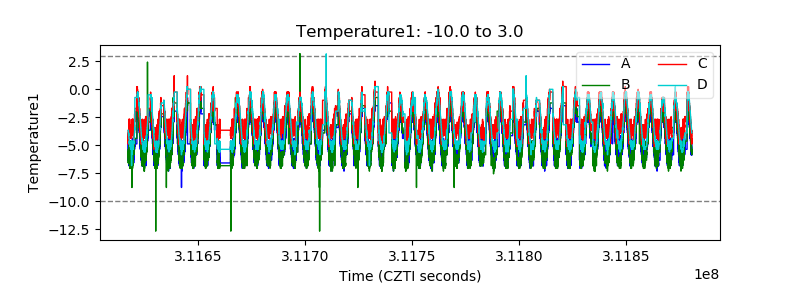 |
| Veto HV Monitor |  |
| Veto LLD |  |
| Alpha Counter |  |
| _CPM_Rate |  |
| CZT Counter |  |
| +2.5 Volts monitor | 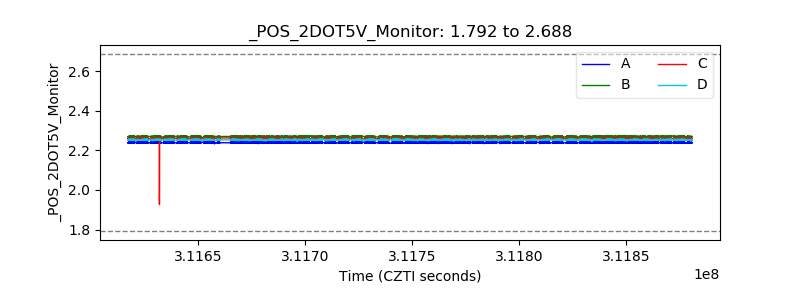 |
| +5 Volts monitor |  |
| _ROLL_ROT |  |
| _Roll_DEC | 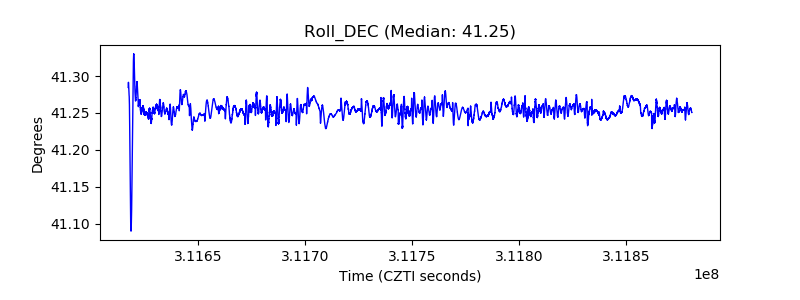 |
| _Roll_RA |  |
| Veto Counter |  |