| Param | Original file | Final file |
|---|---|---|
| Filename | modeM0/AS1T03_147T01_9000003306cztM0_level2_bc.evt | modeM0/AS1T03_147T01_9000003306cztM0_level2_quad_clean.evt |
| Size (bytes) | 2,217,202,560 | 990,538,560 |
| Size | 2.1 GB | 944.7 MB |
| Events in quadrant A | 14,489,564 | 6,373,932 |
| Events in quadrant B | 14,972,257 | 6,534,482 |
| Events in quadrant C | 14,360,760 | 6,204,854 |
| Events in quadrant D | 18,522,608 | 6,062,032 |
| Mode M9 | |||
|---|---|---|---|
| Quadrant | BADHDUFLAG | Total packets | Discarded packets |
| A | 0 | 109 | 0 |
| B | 0 | 109 | 0 |
| C | 0 | 109 | 0 |
| D | 0 | 109 | 0 |
| Mode SS | |||
|---|---|---|---|
| Quadrant | BADHDUFLAG | Total packets | Discarded packets |
| A | 0 | 1438 | 0 |
| B | 0 | 1438 | 0 |
| C | 0 | 1438 | 0 |
| D | 0 | 1438 | 0 |
| Mode M0 | |||
|---|---|---|---|
| Quadrant | BADHDUFLAG | Total packets | Discarded packets |
| A | 0 | 145341 | 0 |
| B | 0 | 146786 | 0 |
| C | 0 | 146503 | 0 |
| D | 0 | 156463 | 0 |
| Quadrant | Total seconds | Saturated seconds | Saturation percentage |
|---|---|---|---|
| A | 70405 | 788 | 1.119239% |
| B | 70405 | 977 | 1.387686% |
| C | 70405 | 1151 | 1.634827% |
| D | 70405 | 1095 | 1.555287% |
Noise dominated data is calculated using 1-second bins in cleaned event files. If a bin has >2000 counts, and if more than 50% of those come from <1% of pixels, then it is considered to be noise-dominated and hence unusable.
| Quadrant | # 1 sec bins | Bins with >0 counts | Bins with >2000 counts | High rate bins dominated by noise | Noise dominated (total time) | Noise dominated (detector-on time) | Marked lightcurve |
|---|---|---|---|---|---|---|---|
| A | 81456 | 70406 | 0 | 0 | 0.00% | 0.00% | 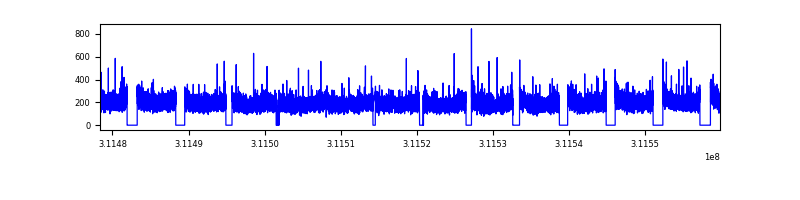 |
| B | 81456 | 70401 | 6 | 6 | 0.01% | 0.01% |  |
| C | 81456 | 70401 | 2 | 2 | 0.00% | 0.00% |  |
| D | 81456 | 70402 | 283 | 283 | 0.35% | 0.40% |  |
Top three noisy pixels from each quadrant. If the there are fewer than three noisy pixels in the level2.evt file, extra rows are filled as -1
| Pixel properties | Quadrant properties | ||||||
|---|---|---|---|---|---|---|---|
| Quadrant | DetID | PixID | Counts | Sigma | Mean | Median | Sigma |
| A | 13 | 254 | 87680 | 103.91 | 3746 | 3678 | 808.4 |
| A | 3 | 1 | 55927 | 64.63 | 3746 | 3678 | 808.4 |
| A | 0 | 226 | 23567 | 24.6 | 3746 | 3678 | 808.4 |
| B | 4 | 171 | 59351 | 77.89 | 3828 | 3737 | 714.0 |
| B | 4 | 173 | 54687 | 71.36 | 3828 | 3737 | 714.0 |
| B | 4 | 52 | 51826 | 67.35 | 3828 | 3737 | 714.0 |
| C | 10 | 22 | 103903 | 116.0 | 3673 | 3651 | 864.2 |
| C | 0 | 10 | 66450 | 72.66 | 3673 | 3651 | 864.2 |
| C | 10 | 1 | 38709 | 40.56 | 3673 | 3651 | 864.2 |
| D | 1 | 52 | 2466767 | 2858.34 | 3720 | 3593 | 861.7 |
| D | 12 | 227 | 1287013 | 1489.32 | 3720 | 3593 | 861.7 |
| D | 2 | 234 | 275854 | 315.94 | 3720 | 3593 | 861.7 |
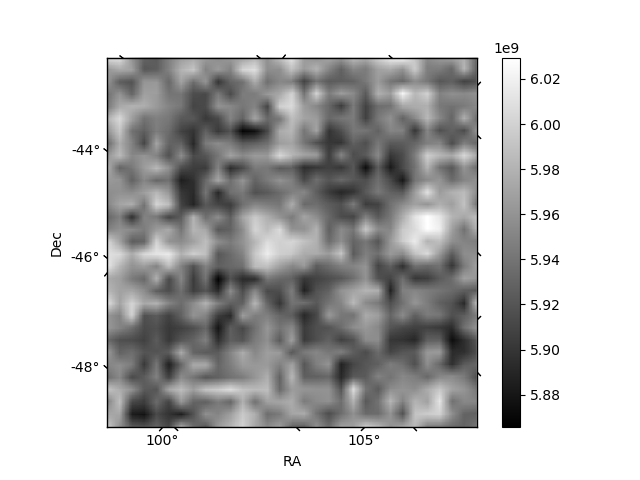
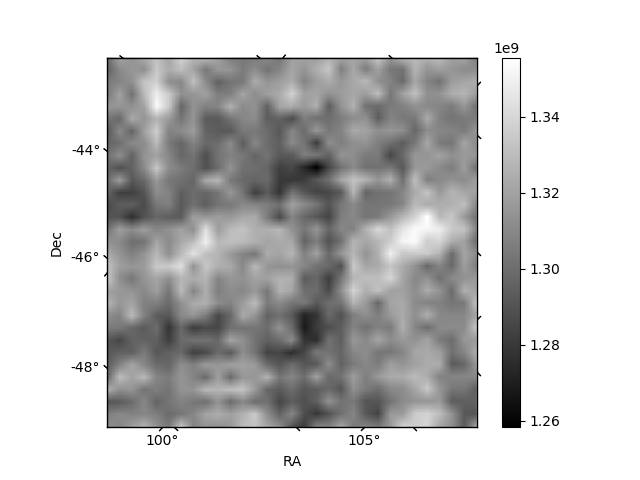
Histogram calculated using DETX and DETY for each event in the final _common_clean file
| Quadrant A |  |
 |
Quadrant B |
|---|---|---|---|
| Quadrant D |  |
 |
Quadrant C |
| Plot type | Count rate plots | Images |
|---|---|---|
| Comparison with Poisson distribution Blue bars denote a histogram of data divided into 1 sec bins. Red curve is a Poisson curve with rate = median count rate of data. |
 |
 |
| Quadrant-wise count rates Data is divided into 100 sec bins |
 |
|
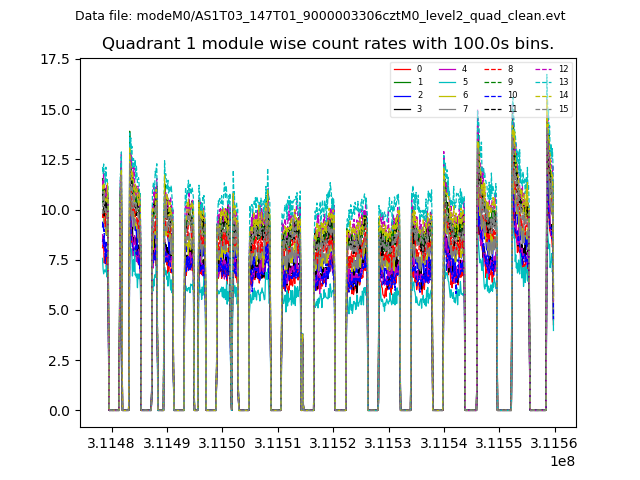
| Module-wise count rates for Quadrant A Data is divided into 100 sec bins |
 |
 |
| Module-wise count rates for Quadrant B Data is divided into 100 sec bins |
 |
 |
| Module-wise count rates for Quadrant C Data is divided into 100 sec bins |
 |
 |
| Module-wise count rates for Quadrant D Data is divided into 100 sec bins |
 |
 |
| Parameter | Plot |
|---|---|
| CZT HV Monitor |  |
| D_VDD |  |
| Temperature 1 |  |
| Veto HV Monitor |  |
| Veto LLD |  |
| Alpha Counter |  |
| _CPM_Rate |  |
| CZT Counter |  |
| +2.5 Volts monitor |  |
| +5 Volts monitor |  |
| _ROLL_ROT | 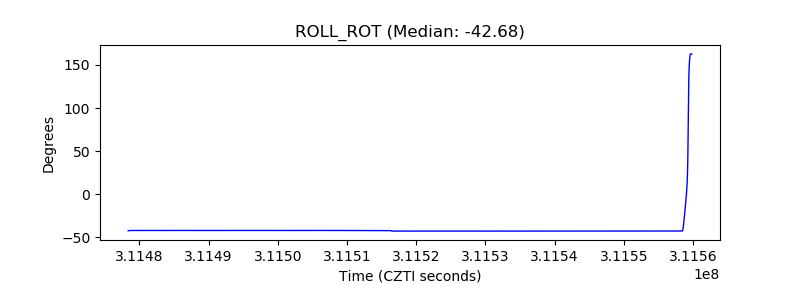 |
| _Roll_DEC |  |
| _Roll_RA | 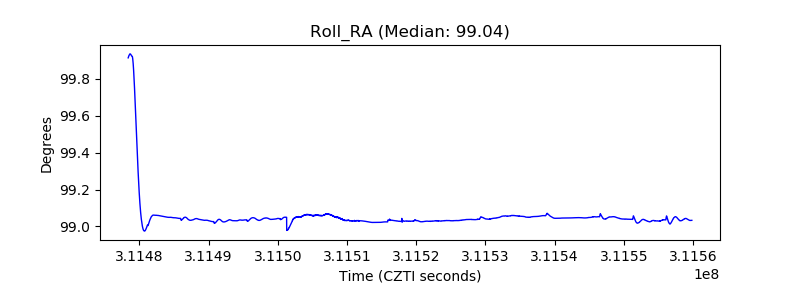 |
| Veto Counter |  |