| Param | Original file | Final file |
|---|---|---|
| Filename | modeM0/AS1A07_149T01_9000003304cztM0_level2_bc.evt | modeM0/AS1A07_149T01_9000003304cztM0_level2_quad_clean.evt |
| Size (bytes) | 2,601,601,920 | 1,237,415,040 |
| Size | 2.4 GB | 1.2 GB |
| Events in quadrant A | 17,072,464 | 8,089,277 |
| Events in quadrant B | 17,823,671 | 8,318,036 |
| Events in quadrant C | 16,759,123 | 7,906,056 |
| Events in quadrant D | 21,657,265 | 7,661,761 |
| Mode SS | |||
|---|---|---|---|
| Quadrant | BADHDUFLAG | Total packets | Discarded packets |
| A | 0 | 1638 | 0 |
| B | 0 | 1638 | 0 |
| C | 0 | 1638 | 0 |
| D | 0 | 1638 | 0 |
| Mode M0 | |||
|---|---|---|---|
| Quadrant | BADHDUFLAG | Total packets | Discarded packets |
| A | 0 | 165860 | 0 |
| B | 0 | 168399 | 0 |
| C | 0 | 166891 | 0 |
| D | 0 | 179661 | 0 |
| Mode M9 | |||
|---|---|---|---|
| Quadrant | BADHDUFLAG | Total packets | Discarded packets |
| A | 0 | 155 | 0 |
| B | 0 | 156 | 0 |
| C | 0 | 156 | 0 |
| D | 0 | 156 | 0 |
| Quadrant | Total seconds | Saturated seconds | Saturation percentage |
|---|---|---|---|
| A | 80336 | 703 | 0.875075% |
| B | 80336 | 928 | 1.155148% |
| C | 80336 | 1151 | 1.432733% |
| D | 80336 | 1099 | 1.368004% |
Noise dominated data is calculated using 1-second bins in cleaned event files. If a bin has >2000 counts, and if more than 50% of those come from <1% of pixels, then it is considered to be noise-dominated and hence unusable.
| Quadrant | # 1 sec bins | Bins with >0 counts | Bins with >2000 counts | High rate bins dominated by noise | Noise dominated (total time) | Noise dominated (detector-on time) | Marked lightcurve |
|---|---|---|---|---|---|---|---|
| A | 107328 | 80338 | 5 | 5 | 0.00% | 0.01% |  |
| B | 107328 | 80332 | 10 | 10 | 0.01% | 0.01% |  |
| C | 107328 | 80337 | 2 | 2 | 0.00% | 0.00% |  |
| D | 107328 | 80339 | 161 | 161 | 0.15% | 0.20% |  |
Top three noisy pixels from each quadrant. If the there are fewer than three noisy pixels in the level2.evt file, extra rows are filled as -1
| Pixel properties | Quadrant properties | ||||||
|---|---|---|---|---|---|---|---|
| Quadrant | DetID | PixID | Counts | Sigma | Mean | Median | Sigma |
| A | 4 | 2 | 108076 | 110.02 | 4388 | 4321 | 943.1 |
| A | 13 | 254 | 101312 | 102.84 | 4388 | 4321 | 943.1 |
| A | 3 | 1 | 50412 | 48.87 | 4388 | 4321 | 943.1 |
| B | 6 | 36 | 174802 | 204.59 | 4498 | 4408 | 832.8 |
| B | 0 | 190 | 106322 | 122.37 | 4498 | 4408 | 832.8 |
| B | 0 | 245 | 102763 | 118.1 | 4498 | 4408 | 832.8 |
| C | 0 | 10 | 96295 | 91.44 | 4299 | 4295 | 1006.2 |
| C | 3 | 9 | 40463 | 35.95 | 4299 | 4295 | 1006.2 |
| C | 10 | 22 | 37032 | 32.54 | 4299 | 4295 | 1006.2 |
| D | 1 | 52 | 3288704 | 3297.83 | 4334 | 4194 | 996.0 |
| D | 13 | 174 | 945701 | 945.32 | 4334 | 4194 | 996.0 |
| D | 2 | 234 | 306466 | 303.5 | 4334 | 4194 | 996.0 |
Histogram calculated using DETX and DETY for each event in the final _common_clean file
| Quadrant A | 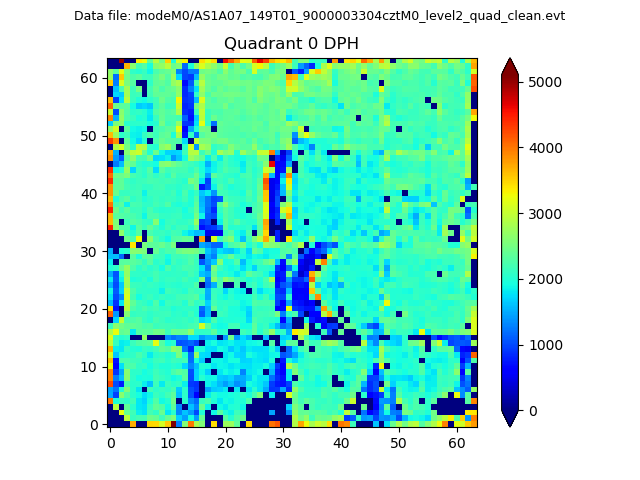 |
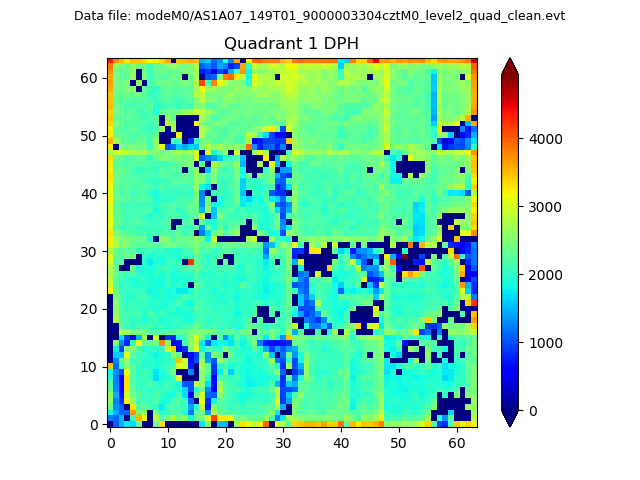 |
Quadrant B |
|---|---|---|---|
| Quadrant D | 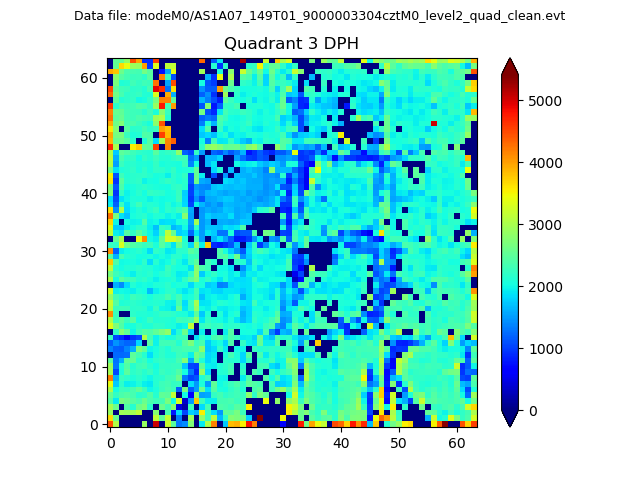 |
 |
Quadrant C |
| Plot type | Count rate plots | Images |
|---|---|---|
| Comparison with Poisson distribution Blue bars denote a histogram of data divided into 1 sec bins. Red curve is a Poisson curve with rate = median count rate of data. |
 |
 |
| Quadrant-wise count rates Data is divided into 100 sec bins |
 |
|
| Module-wise count rates for Quadrant A Data is divided into 100 sec bins |
 |
 |
| Module-wise count rates for Quadrant B Data is divided into 100 sec bins |
 |
 |
| Module-wise count rates for Quadrant C Data is divided into 100 sec bins |
 |
 |
| Module-wise count rates for Quadrant D Data is divided into 100 sec bins |
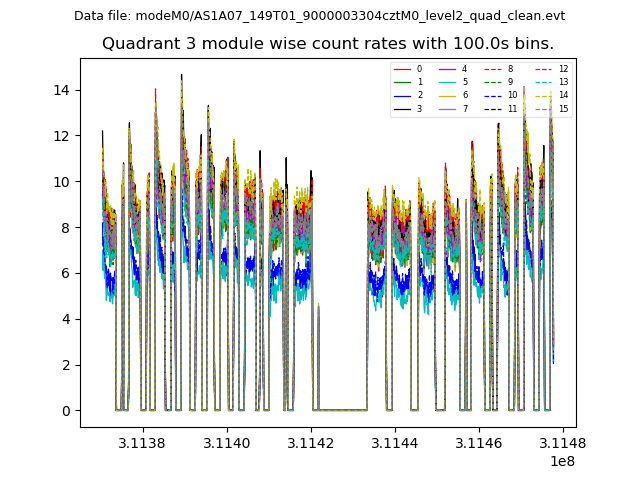 |
 |
| Parameter | Plot |
|---|---|
| CZT HV Monitor | 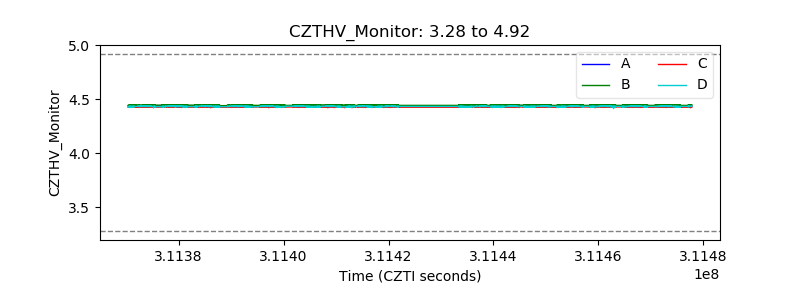 |
| D_VDD |  |
| Temperature 1 |  |
| Veto HV Monitor |  |
| Veto LLD |  |
| Alpha Counter |  |
| _CPM_Rate |  |
| CZT Counter |  |
| +2.5 Volts monitor |  |
| +5 Volts monitor |  |
| _ROLL_ROT |  |
| _Roll_DEC |  |
| _Roll_RA |  |
| Veto Counter | 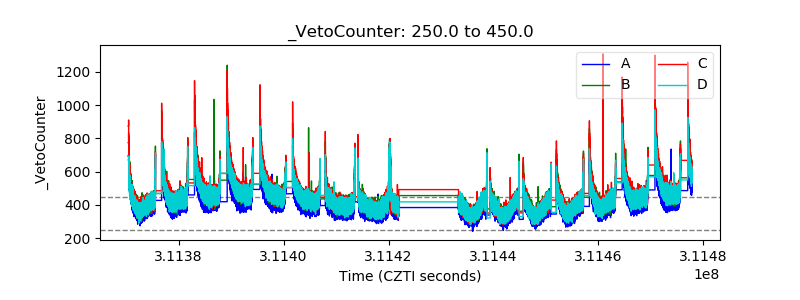 |