| Param | Original file | Final file |
|---|---|---|
| Filename | modeM0/AS1A07_047T09_9000003300cztM0_level2_bc.evt | modeM0/AS1A07_047T09_9000003300cztM0_level2_quad_clean.evt |
| Size (bytes) | 243,872,640 | 112,069,440 |
| Size | 232.6 MB | 106.9 MB |
| Events in quadrant A | 1,579,498 | 721,306 |
| Events in quadrant B | 1,629,148 | 734,741 |
| Events in quadrant C | 1,508,329 | 703,641 |
| Events in quadrant D | 2,121,646 | 685,281 |
| Mode M9 | |||
|---|---|---|---|
| Quadrant | BADHDUFLAG | Total packets | Discarded packets |
| A | 0 | 4 | 0 |
| B | 0 | 4 | 0 |
| C | 0 | 4 | 0 |
| D | 0 | 4 | 0 |
| Mode M0 | |||
|---|---|---|---|
| Quadrant | BADHDUFLAG | Total packets | Discarded packets |
| A | 0 | 16501 | 0 |
| B | 0 | 16611 | 0 |
| C | 0 | 16491 | 0 |
| D | 0 | 18176 | 0 |
| Mode SS | |||
|---|---|---|---|
| Quadrant | BADHDUFLAG | Total packets | Discarded packets |
| A | 0 | 160 | 0 |
| B | 0 | 160 | 0 |
| C | 0 | 160 | 0 |
| D | 0 | 160 | 0 |
| Quadrant | Total seconds | Saturated seconds | Saturation percentage |
|---|---|---|---|
| A | 7907 | 344 | 4.350575% |
| B | 7907 | 366 | 4.628810% |
| C | 7907 | 375 | 4.742633% |
| D | 7907 | 322 | 4.072341% |
Noise dominated data is calculated using 1-second bins in cleaned event files. If a bin has >2000 counts, and if more than 50% of those come from <1% of pixels, then it is considered to be noise-dominated and hence unusable.
| Quadrant | # 1 sec bins | Bins with >0 counts | Bins with >2000 counts | High rate bins dominated by noise | Noise dominated (total time) | Noise dominated (detector-on time) | Marked lightcurve |
|---|---|---|---|---|---|---|---|
| A | 8267 | 7907 | 0 | 0 | 0.00% | 0.00% | 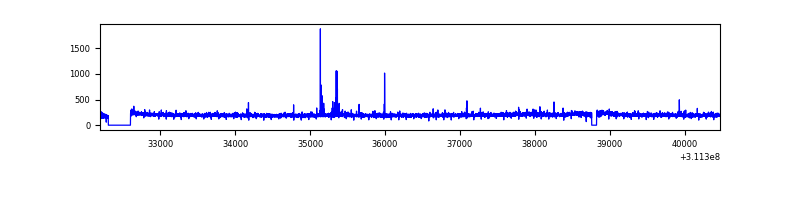 |
| B | 8267 | 7907 | 0 | 0 | 0.00% | 0.00% |  |
| C | 8267 | 7906 | 0 | 0 | 0.00% | 0.00% |  |
| D | 8267 | 7908 | 19 | 19 | 0.23% | 0.24% |  |
Top three noisy pixels from each quadrant. If the there are fewer than three noisy pixels in the level2.evt file, extra rows are filled as -1
| Pixel properties | Quadrant properties | ||||||
|---|---|---|---|---|---|---|---|
| Quadrant | DetID | PixID | Counts | Sigma | Mean | Median | Sigma |
| A | 4 | 2 | 18808 | 203.36 | 403 | 394 | 90.6 |
| A | 13 | 254 | 8760 | 92.39 | 403 | 394 | 90.6 |
| A | 3 | 1 | 5042 | 51.33 | 403 | 394 | 90.6 |
| B | 0 | 190 | 28027 | 343.33 | 408 | 397 | 80.5 |
| B | 3 | 64 | 8853 | 105.08 | 408 | 397 | 80.5 |
| B | 0 | 197 | 7062 | 82.82 | 408 | 397 | 80.5 |
| C | 8 | 128 | 4293 | 41.54 | 390 | 387 | 94.0 |
| C | 13 | 61 | 2243 | 19.74 | 390 | 387 | 94.0 |
| C | 8 | 112 | 2020 | 17.37 | 390 | 387 | 94.0 |
| D | 1 | 52 | 243974 | 2575.36 | 397 | 383 | 94.6 |
| D | 14 | 34 | 217998 | 2300.73 | 397 | 383 | 94.6 |
| D | 13 | 172 | 42730 | 447.71 | 397 | 383 | 94.6 |
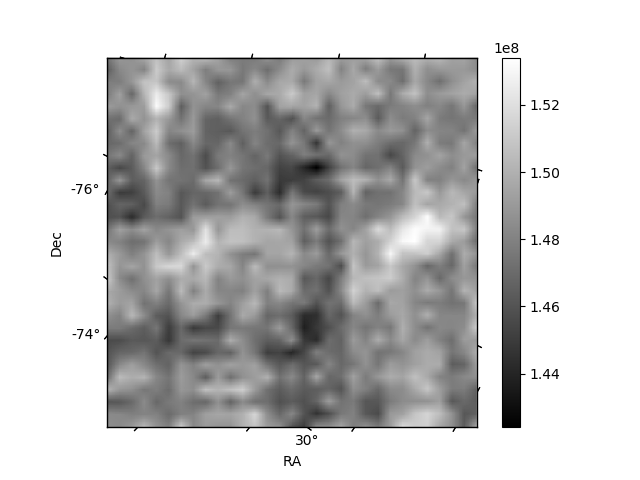
Histogram calculated using DETX and DETY for each event in the final _common_clean file
| Quadrant A |  |
 |
Quadrant B |
|---|---|---|---|
| Quadrant D |  |
 |
Quadrant C |
| Plot type | Count rate plots | Images |
|---|---|---|
| Comparison with Poisson distribution Blue bars denote a histogram of data divided into 1 sec bins. Red curve is a Poisson curve with rate = median count rate of data. |
 |
 |
| Quadrant-wise count rates Data is divided into 100 sec bins |
 |
|
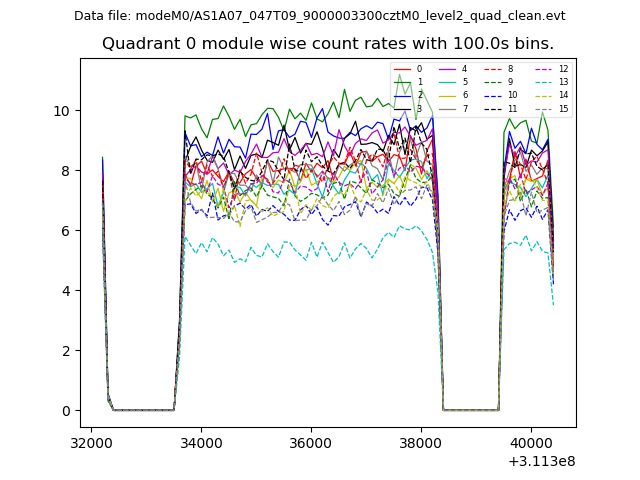
| Module-wise count rates for Quadrant A Data is divided into 100 sec bins |
 |
 |
| Module-wise count rates for Quadrant B Data is divided into 100 sec bins |
 |
 |
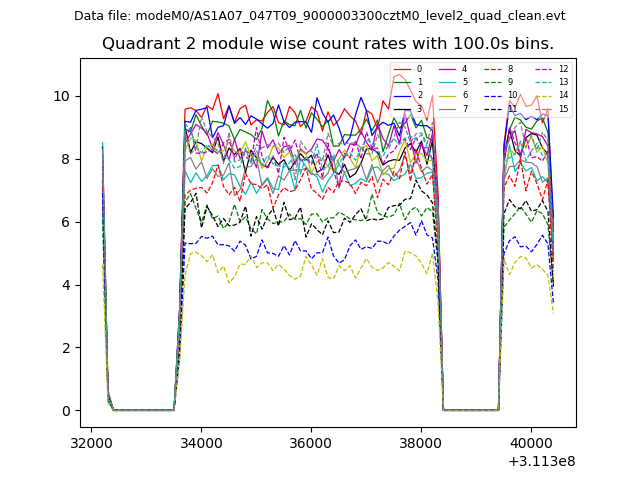
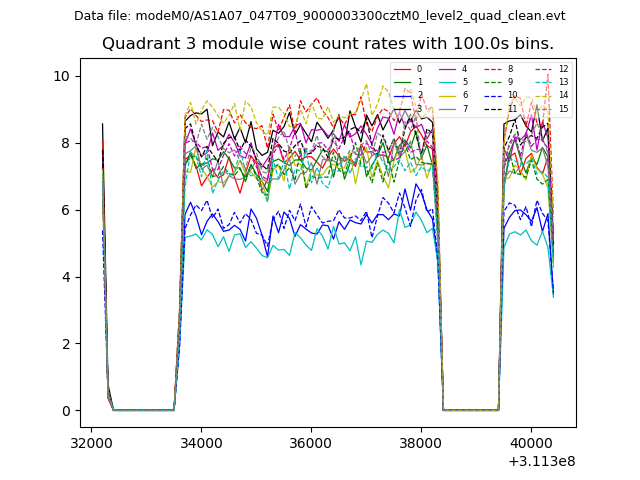
| Module-wise count rates for Quadrant C Data is divided into 100 sec bins |
 |
 |
| Module-wise count rates for Quadrant D Data is divided into 100 sec bins |
 |
 |
| Parameter | Plot |
|---|---|
| CZT HV Monitor |  |
| D_VDD |  |
| Temperature 1 | 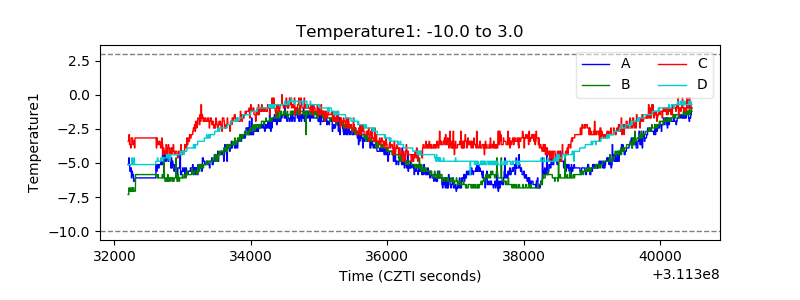 |
| Veto HV Monitor | 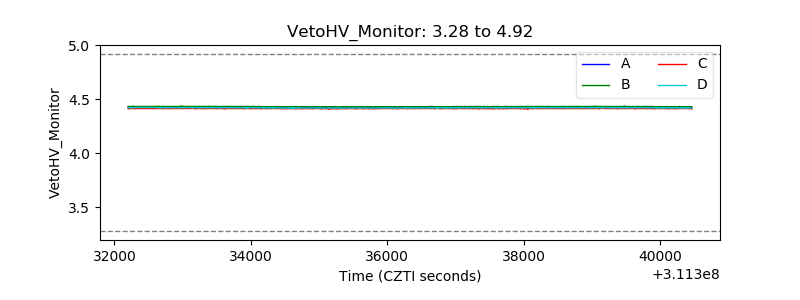 |
| Veto LLD | 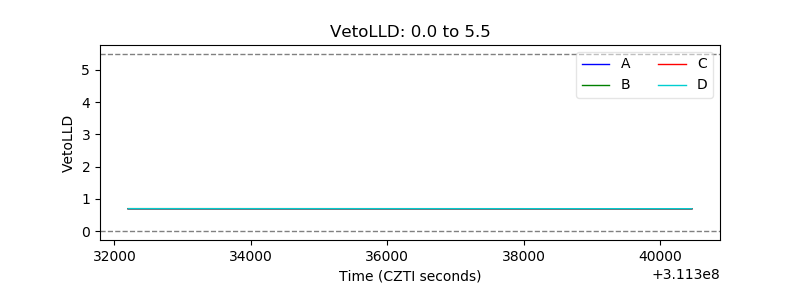 |
| Alpha Counter |  |
| _CPM_Rate |  |
| CZT Counter | 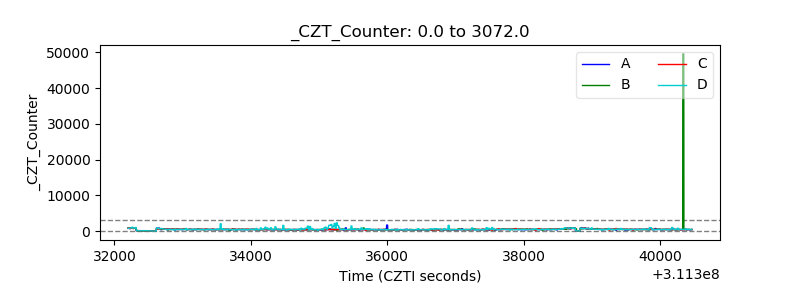 |
| +2.5 Volts monitor |  |
| +5 Volts monitor |  |
| _ROLL_ROT |  |
| _Roll_DEC | 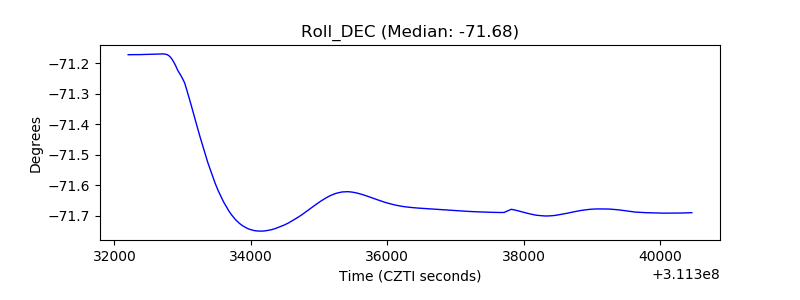 |
| _Roll_RA |  |
| Veto Counter |  |