| Param | Original file | Final file |
|---|---|---|
| Filename | modeM0/AS1A07_018T07_9000003294cztM0_level2_bc.evt | modeM0/AS1A07_018T07_9000003294cztM0_level2_quad_clean.evt |
| Size (bytes) | 2,901,504,960 | 964,814,400 |
| Size | 2.7 GB | 920.1 MB |
| Events in quadrant A | 15,884,632 | 6,231,985 |
| Events in quadrant B | 16,646,705 | 6,321,507 |
| Events in quadrant C | 17,259,248 | 5,947,941 |
| Events in quadrant D | 32,937,376 | 5,546,560 |
| Mode M9 | |||
|---|---|---|---|
| Quadrant | BADHDUFLAG | Total packets | Discarded packets |
| A | 0 | 109 | 0 |
| B | 0 | 109 | 0 |
| C | 0 | 109 | 0 |
| D | 0 | 109 | 0 |
| Mode M0 | |||
|---|---|---|---|
| Quadrant | BADHDUFLAG | Total packets | Discarded packets |
| A | 0 | 157329 | 0 |
| B | 0 | 160033 | 0 |
| C | 0 | 164183 | 0 |
| D | 0 | 224747 | 0 |
| Mode SS | |||
|---|---|---|---|
| Quadrant | BADHDUFLAG | Total packets | Discarded packets |
| A | 0 | 1540 | 0 |
| B | 0 | 1540 | 0 |
| C | 0 | 1540 | 0 |
| D | 0 | 1540 | 0 |
| Quadrant | Total seconds | Saturated seconds | Saturation percentage |
|---|---|---|---|
| A | 75446 | 1058 | 1.402327% |
| B | 75444 | 1405 | 1.862308% |
| C | 75446 | 2017 | 2.673435% |
| D | 75447 | 8150 | 10.802285% |
Noise dominated data is calculated using 1-second bins in cleaned event files. If a bin has >2000 counts, and if more than 50% of those come from <1% of pixels, then it is considered to be noise-dominated and hence unusable.
| Quadrant | # 1 sec bins | Bins with >0 counts | Bins with >2000 counts | High rate bins dominated by noise | Noise dominated (total time) | Noise dominated (detector-on time) | Marked lightcurve |
|---|---|---|---|---|---|---|---|
| A | 98707 | 75448 | 0 | 0 | 0.00% | 0.00% |  |
| B | 98707 | 75448 | 14 | 14 | 0.01% | 0.02% |  |
| C | 98707 | 75450 | 350 | 350 | 0.35% | 0.46% |  |
| D | 98707 | 75442 | 1484 | 1484 | 1.50% | 1.97% | 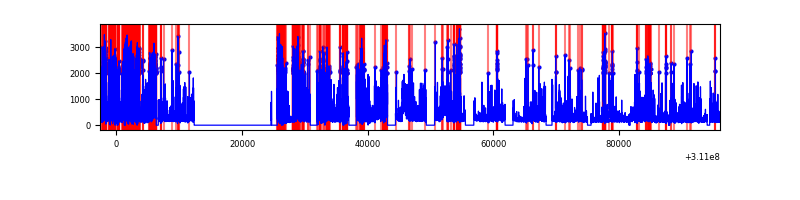 |
Top three noisy pixels from each quadrant. If the there are fewer than three noisy pixels in the level2.evt file, extra rows are filled as -1
| Pixel properties | Quadrant properties | ||||||
|---|---|---|---|---|---|---|---|
| Quadrant | DetID | PixID | Counts | Sigma | Mean | Median | Sigma |
| A | 13 | 254 | 101867 | 110.41 | 4115 | 4039 | 886.0 |
| A | 0 | 226 | 26296 | 25.12 | 4115 | 4039 | 886.0 |
| A | 12 | 194 | 25808 | 24.57 | 4115 | 4039 | 886.0 |
| B | 3 | 64 | 455023 | 586.12 | 4155 | 4052 | 769.4 |
| B | 4 | 171 | 136607 | 172.28 | 4155 | 4052 | 769.4 |
| B | 4 | 173 | 45588 | 53.98 | 4155 | 4052 | 769.4 |
| C | 10 | 22 | 2060134 | 2244.63 | 3924 | 3903 | 916.1 |
| C | 3 | 9 | 97476 | 102.15 | 3924 | 3903 | 916.1 |
| C | 13 | 61 | 22910 | 20.75 | 3924 | 3903 | 916.1 |
| D | 1 | 52 | 15093696 | 17253.03 | 3834 | 3702 | 874.6 |
| D | 12 | 235 | 1421210 | 1620.7 | 3834 | 3702 | 874.6 |
| D | 12 | 227 | 414896 | 470.14 | 3834 | 3702 | 874.6 |
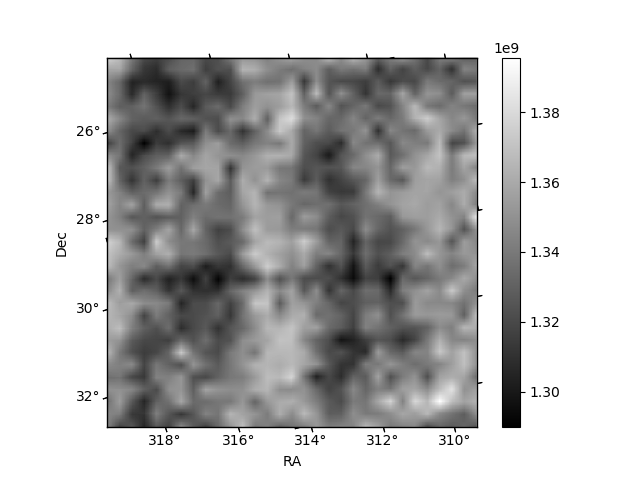
Histogram calculated using DETX and DETY for each event in the final _common_clean file
| Quadrant A | 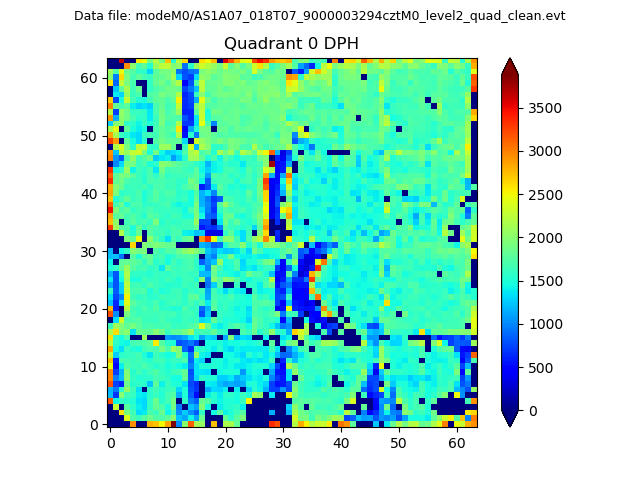 |
 |
Quadrant B |
|---|---|---|---|
| Quadrant D |  |
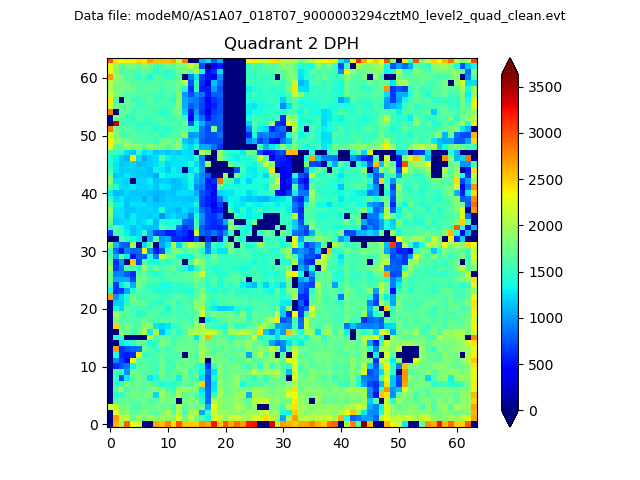 |
Quadrant C |
| Plot type | Count rate plots | Images |
|---|---|---|
| Comparison with Poisson distribution Blue bars denote a histogram of data divided into 1 sec bins. Red curve is a Poisson curve with rate = median count rate of data. |
 |
 |
| Quadrant-wise count rates Data is divided into 100 sec bins |
 |
|
| Module-wise count rates for Quadrant A Data is divided into 100 sec bins |
 |
 |
| Module-wise count rates for Quadrant B Data is divided into 100 sec bins |
 |
 |
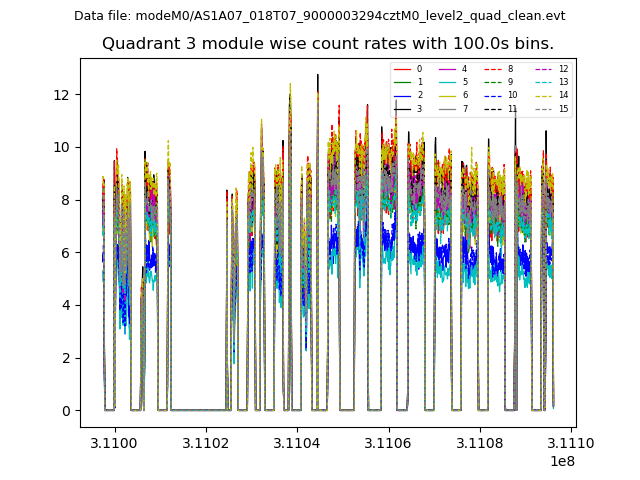
| Module-wise count rates for Quadrant C Data is divided into 100 sec bins |
 |
 |
| Module-wise count rates for Quadrant D Data is divided into 100 sec bins |
 |
 |
| Parameter | Plot |
|---|---|
| CZT HV Monitor |  |
| D_VDD |  |
| Temperature 1 |  |
| Veto HV Monitor |  |
| Veto LLD |  |
| Alpha Counter |  |
| _CPM_Rate |  |
| CZT Counter |  |
| +2.5 Volts monitor | 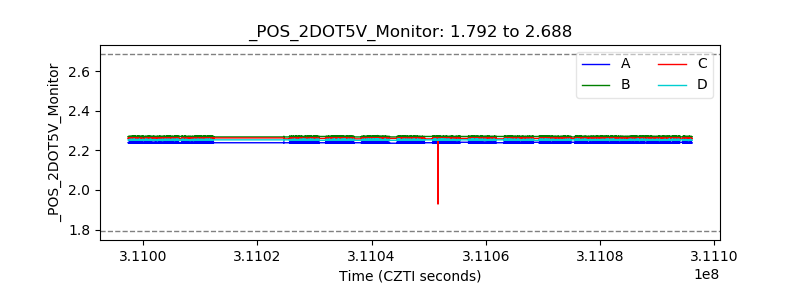 |
| +5 Volts monitor |  |
| _ROLL_ROT |  |
| _Roll_DEC | 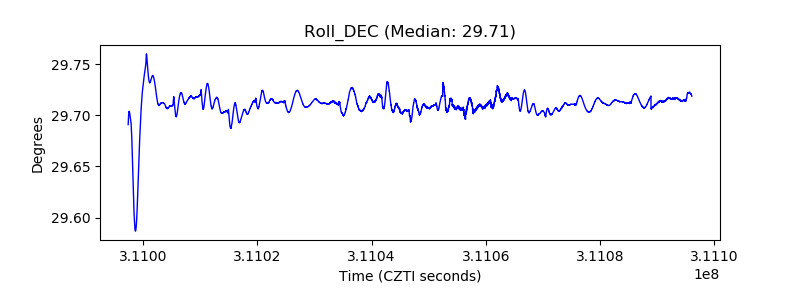 |
| _Roll_RA |  |
| Veto Counter |  |