| Param | Original file | Final file |
|---|---|---|
| Filename | modeM0/AS1A07_018T02_9000003292cztM0_level2_bc.evt | modeM0/AS1A07_018T02_9000003292cztM0_level2_quad_clean.evt |
| Size (bytes) | 934,332,480 | 382,596,480 |
| Size | 891.0 MB | 364.9 MB |
| Events in quadrant A | 5,583,966 | 2,527,891 |
| Events in quadrant B | 5,836,047 | 2,565,559 |
| Events in quadrant C | 5,703,766 | 2,434,262 |
| Events in quadrant D | 9,415,290 | 2,293,386 |
| Mode M0 | |||
|---|---|---|---|
| Quadrant | BADHDUFLAG | Total packets | Discarded packets |
| A | 0 | 53912 | 0 |
| B | 0 | 54842 | 0 |
| C | 0 | 55207 | 0 |
| D | 0 | 69706 | 0 |
| Mode M9 | |||
|---|---|---|---|
| Quadrant | BADHDUFLAG | Total packets | Discarded packets |
| A | 0 | 51 | 0 |
| B | 0 | 51 | 0 |
| C | 0 | 51 | 0 |
| D | 0 | 51 | 0 |
| Mode SS | |||
|---|---|---|---|
| Quadrant | BADHDUFLAG | Total packets | Discarded packets |
| A | 0 | 524 | 0 |
| B | 0 | 524 | 0 |
| C | 0 | 524 | 0 |
| D | 0 | 524 | 0 |
| Quadrant | Total seconds | Saturated seconds | Saturation percentage |
|---|---|---|---|
| A | 25705 | 447 | 1.738961% |
| B | 25705 | 582 | 2.264151% |
| C | 25705 | 589 | 2.291383% |
| D | 25705 | 1499 | 5.831550% |
Noise dominated data is calculated using 1-second bins in cleaned event files. If a bin has >2000 counts, and if more than 50% of those come from <1% of pixels, then it is considered to be noise-dominated and hence unusable.
| Quadrant | # 1 sec bins | Bins with >0 counts | Bins with >2000 counts | High rate bins dominated by noise | Noise dominated (total time) | Noise dominated (detector-on time) | Marked lightcurve |
|---|---|---|---|---|---|---|---|
| A | 30676 | 25705 | 0 | 0 | 0.00% | 0.00% |  |
| B | 30676 | 25705 | 8 | 8 | 0.03% | 0.03% |  |
| C | 30676 | 25706 | 6 | 6 | 0.02% | 0.02% |  |
| D | 30676 | 25703 | 182 | 182 | 0.59% | 0.71% |  |
Top three noisy pixels from each quadrant. If the there are fewer than three noisy pixels in the level2.evt file, extra rows are filled as -1
| Pixel properties | Quadrant properties | ||||||
|---|---|---|---|---|---|---|---|
| Quadrant | DetID | PixID | Counts | Sigma | Mean | Median | Sigma |
| A | 13 | 254 | 36618 | 112.91 | 1449 | 1424 | 311.7 |
| A | 0 | 226 | 9508 | 25.93 | 1449 | 1424 | 311.7 |
| A | 12 | 194 | 8974 | 24.22 | 1449 | 1424 | 311.7 |
| B | 0 | 190 | 66573 | 238.58 | 1462 | 1430 | 273.0 |
| B | 3 | 64 | 63630 | 227.8 | 1462 | 1430 | 273.0 |
| B | 4 | 173 | 40183 | 141.93 | 1462 | 1430 | 273.0 |
| C | 10 | 22 | 377246 | 1157.9 | 1384 | 1380 | 324.6 |
| C | 0 | 10 | 13996 | 38.87 | 1384 | 1380 | 324.6 |
| C | 13 | 61 | 8028 | 20.48 | 1384 | 1380 | 324.6 |
| D | 1 | 52 | 3719800 | 11762.51 | 1381 | 1337 | 316.1 |
| D | 13 | 172 | 127922 | 400.42 | 1381 | 1337 | 316.1 |
| D | 2 | 136 | 107966 | 337.3 | 1381 | 1337 | 316.1 |
Histogram calculated using DETX and DETY for each event in the final _common_clean file
| Quadrant A |  |
 |
Quadrant B |
|---|---|---|---|
| Quadrant D | 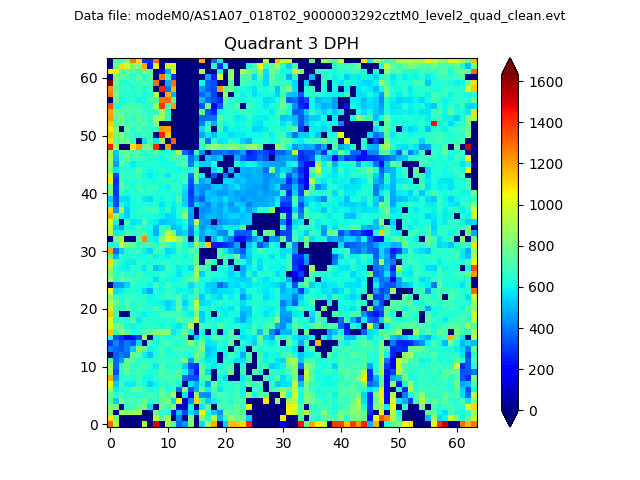 |
 |
Quadrant C |
| Plot type | Count rate plots | Images |
|---|---|---|
| Comparison with Poisson distribution Blue bars denote a histogram of data divided into 1 sec bins. Red curve is a Poisson curve with rate = median count rate of data. |
 |
 |
| Quadrant-wise count rates Data is divided into 100 sec bins |
 |
|
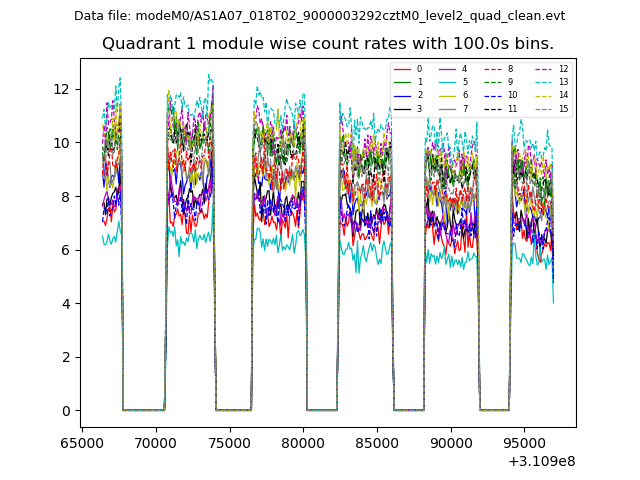
| Module-wise count rates for Quadrant A Data is divided into 100 sec bins |
 |
 |
| Module-wise count rates for Quadrant B Data is divided into 100 sec bins |
 |
 |
| Module-wise count rates for Quadrant C Data is divided into 100 sec bins |
 |
 |
| Module-wise count rates for Quadrant D Data is divided into 100 sec bins |
 |
 |
| Parameter | Plot |
|---|---|
| CZT HV Monitor |  |
| D_VDD |  |
| Temperature 1 |  |
| Veto HV Monitor |  |
| Veto LLD |  |
| Alpha Counter |  |
| _CPM_Rate |  |
| CZT Counter |  |
| +2.5 Volts monitor |  |
| +5 Volts monitor |  |
| _ROLL_ROT |  |
| _Roll_DEC |  |
| _Roll_RA |  |
| Veto Counter |  |