| Param | Original file | Final file |
|---|---|---|
| Filename | modeM0/AS1T03_147T01_9000003290cztM0_level2_bc.evt | modeM0/AS1T03_147T01_9000003290cztM0_level2_quad_clean.evt |
| Size (bytes) | 1,499,892,480 | 585,296,640 |
| Size | 1.4 GB | 558.2 MB |
| Events in quadrant A | 8,958,331 | 3,816,200 |
| Events in quadrant B | 9,183,777 | 3,917,431 |
| Events in quadrant C | 9,257,860 | 3,715,842 |
| Events in quadrant D | 15,300,938 | 3,539,325 |
| Mode SS | |||
|---|---|---|---|
| Quadrant | BADHDUFLAG | Total packets | Discarded packets |
| A | 0 | 736 | 0 |
| B | 0 | 736 | 0 |
| C | 0 | 736 | 0 |
| D | 0 | 736 | 0 |
| Mode M9 | |||
|---|---|---|---|
| Quadrant | BADHDUFLAG | Total packets | Discarded packets |
| A | 0 | 64 | 0 |
| B | 0 | 65 | 0 |
| C | 0 | 65 | 0 |
| D | 0 | 65 | 0 |
| Mode M0 | |||
|---|---|---|---|
| Quadrant | BADHDUFLAG | Total packets | Discarded packets |
| A | 0 | 84012 | 0 |
| B | 0 | 84715 | 0 |
| C | 0 | 86874 | 0 |
| D | 0 | 114663 | 0 |
| Quadrant | Total seconds | Saturated seconds | Saturation percentage |
|---|---|---|---|
| A | 40148 | 557 | 1.387367% |
| B | 40148 | 637 | 1.586629% |
| C | 40147 | 935 | 2.328941% |
| D | 40147 | 3933 | 9.796498% |
Noise dominated data is calculated using 1-second bins in cleaned event files. If a bin has >2000 counts, and if more than 50% of those come from <1% of pixels, then it is considered to be noise-dominated and hence unusable.
| Quadrant | # 1 sec bins | Bins with >0 counts | Bins with >2000 counts | High rate bins dominated by noise | Noise dominated (total time) | Noise dominated (detector-on time) | Marked lightcurve |
|---|---|---|---|---|---|---|---|
| A | 89359 | 40150 | 0 | 0 | 0.00% | 0.00% |  |
| B | 89359 | 40149 | 0 | 0 | 0.00% | 0.00% | 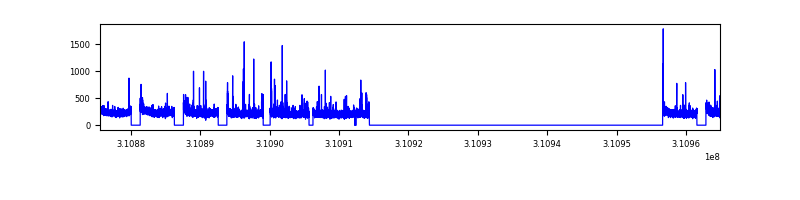 |
| C | 89359 | 40147 | 18 | 18 | 0.02% | 0.04% |  |
| D | 89359 | 40142 | 307 | 307 | 0.34% | 0.76% |  |
Top three noisy pixels from each quadrant. If the there are fewer than three noisy pixels in the level2.evt file, extra rows are filled as -1
| Pixel properties | Quadrant properties | ||||||
|---|---|---|---|---|---|---|---|
| Quadrant | DetID | PixID | Counts | Sigma | Mean | Median | Sigma |
| A | 2 | 79 | 54607 | 106.92 | 2302 | 2264 | 489.5 |
| A | 13 | 254 | 54298 | 106.29 | 2302 | 2264 | 489.5 |
| A | 15 | 192 | 21582 | 39.46 | 2302 | 2264 | 489.5 |
| B | 0 | 219 | 66448 | 149.11 | 2337 | 2285 | 430.3 |
| B | 4 | 173 | 54555 | 121.47 | 2337 | 2285 | 430.3 |
| B | 0 | 190 | 50288 | 111.56 | 2337 | 2285 | 430.3 |
| C | 10 | 22 | 549781 | 1038.2 | 2250 | 2247 | 527.4 |
| C | 0 | 10 | 46495 | 83.9 | 2250 | 2247 | 527.4 |
| C | 9 | 54 | 15576 | 25.27 | 2250 | 2247 | 527.4 |
| D | 1 | 52 | 4376838 | 8806.04 | 2190 | 2124 | 496.8 |
| D | 2 | 16 | 1198204 | 2407.64 | 2190 | 2124 | 496.8 |
| D | 12 | 235 | 814084 | 1634.43 | 2190 | 2124 | 496.8 |
Histogram calculated using DETX and DETY for each event in the final _common_clean file
| Quadrant A | 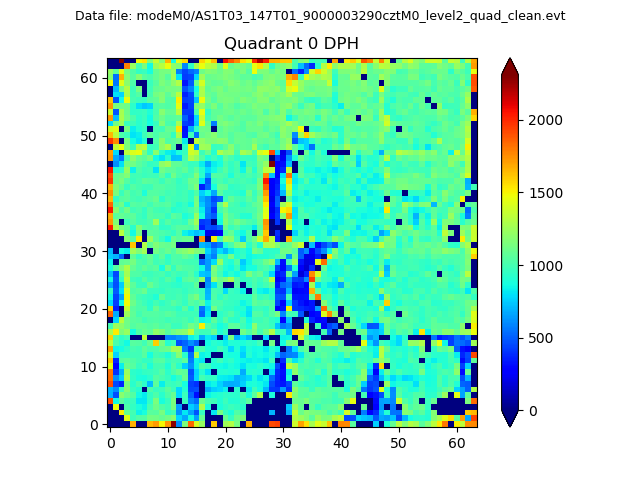 |
 |
Quadrant B |
|---|---|---|---|
| Quadrant D | 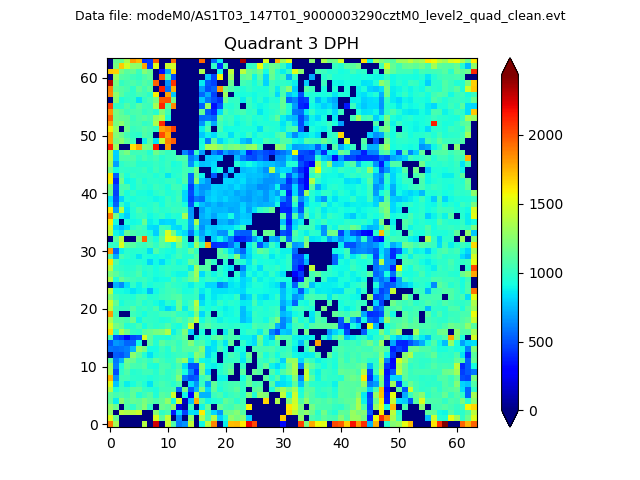 |
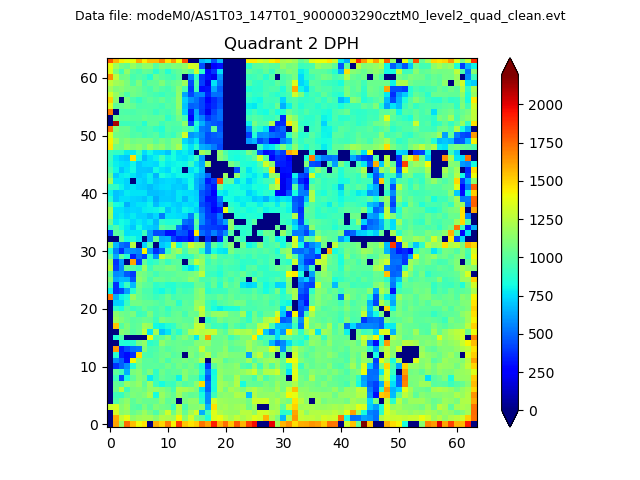 |
Quadrant C |
| Plot type | Count rate plots | Images |
|---|---|---|
| Comparison with Poisson distribution Blue bars denote a histogram of data divided into 1 sec bins. Red curve is a Poisson curve with rate = median count rate of data. |
 |
 |
| Quadrant-wise count rates Data is divided into 100 sec bins |
 |
|
| Module-wise count rates for Quadrant A Data is divided into 100 sec bins |
 |
 |
| Module-wise count rates for Quadrant B Data is divided into 100 sec bins |
 |
 |
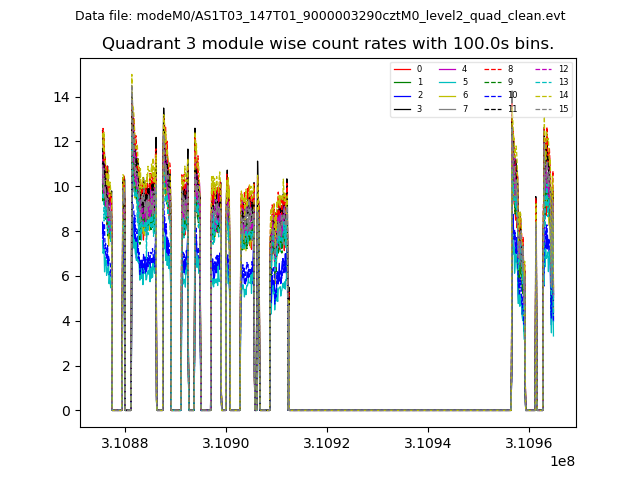
| Module-wise count rates for Quadrant C Data is divided into 100 sec bins |
 |
 |
| Module-wise count rates for Quadrant D Data is divided into 100 sec bins |
 |
 |
| Parameter | Plot |
|---|---|
| CZT HV Monitor |  |
| D_VDD | 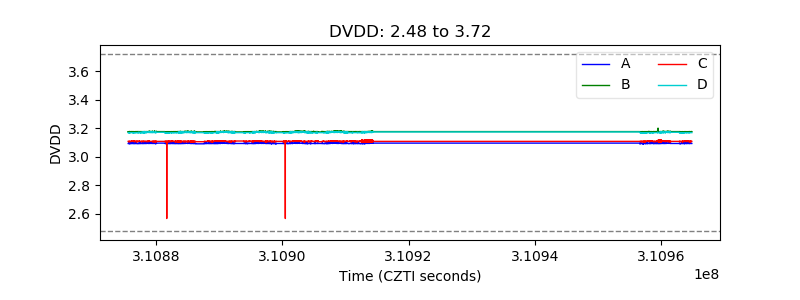 |
| Temperature 1 |  |
| Veto HV Monitor |  |
| Veto LLD |  |
| Alpha Counter |  |
| _CPM_Rate |  |
| CZT Counter |  |
| +2.5 Volts monitor | 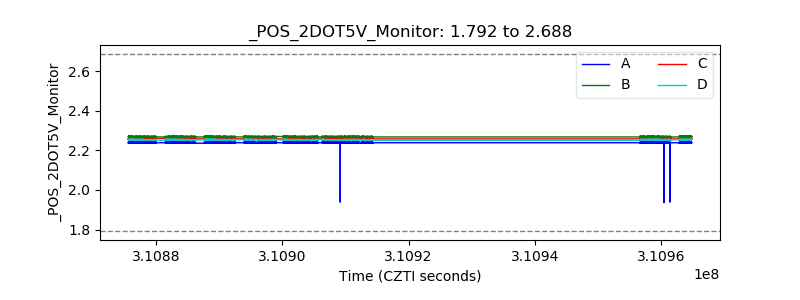 |
| +5 Volts monitor |  |
| _ROLL_ROT | 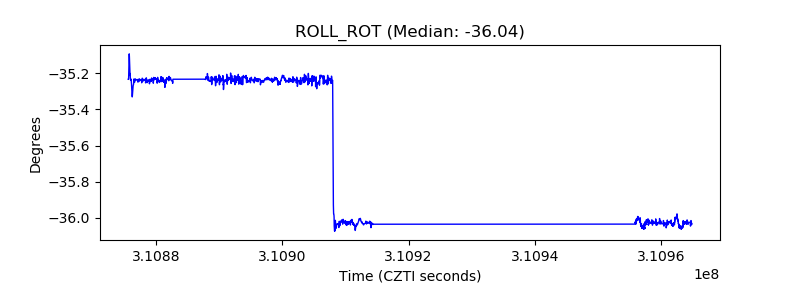 |
| _Roll_DEC |  |
| _Roll_RA |  |
| Veto Counter |  |