| Param | Original file | Final file |
|---|---|---|
| Filename | modeM0/AS1A07_018T02_9000003288cztM0_level2_bc.evt | modeM0/AS1A07_018T02_9000003288cztM0_level2_quad_clean.evt |
| Size (bytes) | 342,296,640 | 126,659,520 |
| Size | 326.4 MB | 120.8 MB |
| Events in quadrant A | 2,245,085 | 800,071 |
| Events in quadrant B | 2,260,853 | 820,838 |
| Events in quadrant C | 2,075,497 | 771,318 |
| Events in quadrant D | 3,090,683 | 744,946 |
| Mode M0 | |||
|---|---|---|---|
| Quadrant | BADHDUFLAG | Total packets | Discarded packets |
| A | 0 | 21035 | 0 |
| B | 0 | 21144 | 0 |
| C | 0 | 20888 | 0 |
| D | 0 | 23753 | 0 |
| Mode M9 | |||
|---|---|---|---|
| Quadrant | BADHDUFLAG | Total packets | Discarded packets |
| A | 0 | 18 | 0 |
| B | 0 | 19 | 0 |
| C | 0 | 19 | 0 |
| D | 0 | 19 | 0 |
| Mode SS | |||
|---|---|---|---|
| Quadrant | BADHDUFLAG | Total packets | Discarded packets |
| A | 0 | 206 | 0 |
| B | 0 | 206 | 0 |
| C | 0 | 206 | 0 |
| D | 0 | 206 | 0 |
| Quadrant | Total seconds | Saturated seconds | Saturation percentage |
|---|---|---|---|
| A | 10085 | 42 | 0.416460% |
| B | 10085 | 64 | 0.634606% |
| C | 10085 | 75 | 0.743679% |
| D | 10085 | 63 | 0.624690% |
Noise dominated data is calculated using 1-second bins in cleaned event files. If a bin has >2000 counts, and if more than 50% of those come from <1% of pixels, then it is considered to be noise-dominated and hence unusable.
| Quadrant | # 1 sec bins | Bins with >0 counts | Bins with >2000 counts | High rate bins dominated by noise | Noise dominated (total time) | Noise dominated (detector-on time) | Marked lightcurve |
|---|---|---|---|---|---|---|---|
| A | 11244 | 10084 | 2 | 2 | 0.02% | 0.02% |  |
| B | 11244 | 10084 | 0 | 0 | 0.00% | 0.00% |  |
| C | 11244 | 10084 | 0 | 0 | 0.00% | 0.00% |  |
| D | 11244 | 10084 | 2 | 2 | 0.02% | 0.02% |  |
Top three noisy pixels from each quadrant. If the there are fewer than three noisy pixels in the level2.evt file, extra rows are filled as -1
| Pixel properties | Quadrant properties | ||||||
|---|---|---|---|---|---|---|---|
| Quadrant | DetID | PixID | Counts | Sigma | Mean | Median | Sigma |
| A | 4 | 2 | 90615 | 738.02 | 558 | 546 | 122.0 |
| A | 13 | 254 | 14963 | 118.13 | 558 | 546 | 122.0 |
| A | 0 | 226 | 3555 | 24.66 | 558 | 546 | 122.0 |
| B | 0 | 219 | 31776 | 289.26 | 568 | 555 | 107.9 |
| B | 4 | 173 | 30023 | 273.02 | 568 | 555 | 107.9 |
| B | 4 | 216 | 25281 | 229.08 | 568 | 555 | 107.9 |
| C | 0 | 10 | 14022 | 107.26 | 536 | 532 | 125.8 |
| C | 13 | 61 | 3140 | 20.74 | 536 | 532 | 125.8 |
| C | 4 | 175 | 2461 | 15.34 | 536 | 532 | 125.8 |
| D | 2 | 16 | 910456 | 7185.77 | 542 | 523 | 126.6 |
| D | 2 | 234 | 36722 | 285.86 | 542 | 523 | 126.6 |
| D | 1 | 52 | 35785 | 278.47 | 542 | 523 | 126.6 |
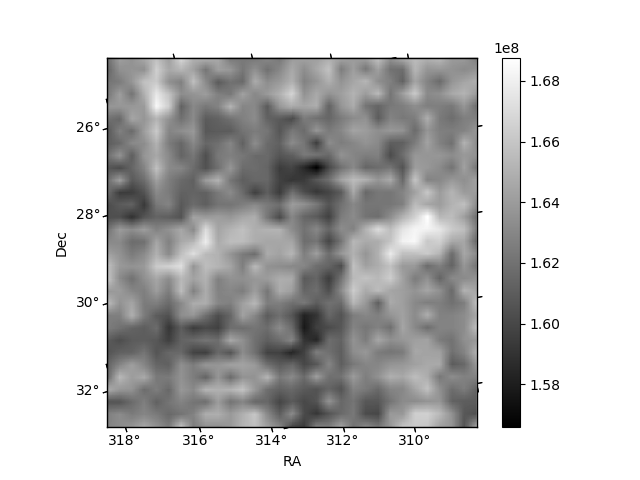
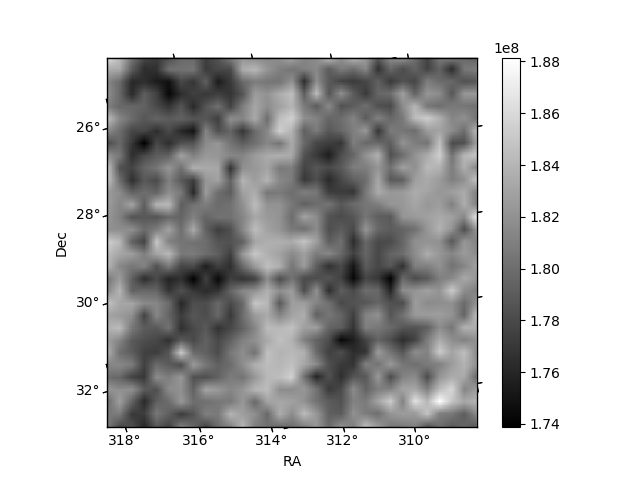
Histogram calculated using DETX and DETY for each event in the final _common_clean file
| Quadrant A |  |
 |
Quadrant B |
|---|---|---|---|
| Quadrant D |  |
 |
Quadrant C |
| Plot type | Count rate plots | Images |
|---|---|---|
| Comparison with Poisson distribution Blue bars denote a histogram of data divided into 1 sec bins. Red curve is a Poisson curve with rate = median count rate of data. |
 |
 |
| Quadrant-wise count rates Data is divided into 100 sec bins |
 |
|
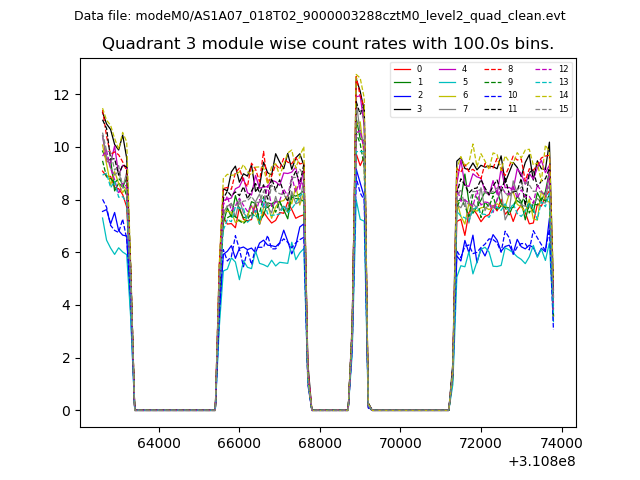
| Module-wise count rates for Quadrant A Data is divided into 100 sec bins |
 |
 |
| Module-wise count rates for Quadrant B Data is divided into 100 sec bins |
 |
 |
| Module-wise count rates for Quadrant C Data is divided into 100 sec bins |
 |
 |
| Module-wise count rates for Quadrant D Data is divided into 100 sec bins |
 |
 |
| Parameter | Plot |
|---|---|
| CZT HV Monitor |  |
| D_VDD |  |
| Temperature 1 |  |
| Veto HV Monitor |  |
| Veto LLD | 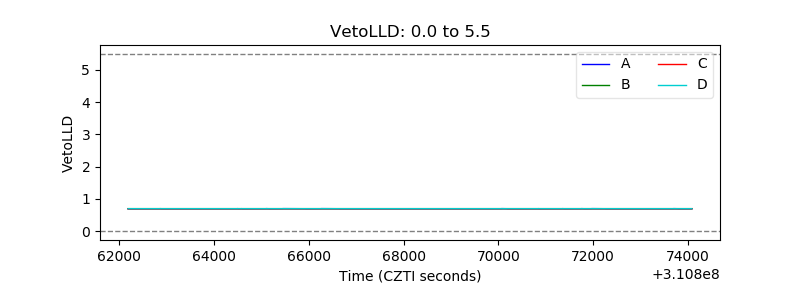 |
| Alpha Counter |  |
| _CPM_Rate | 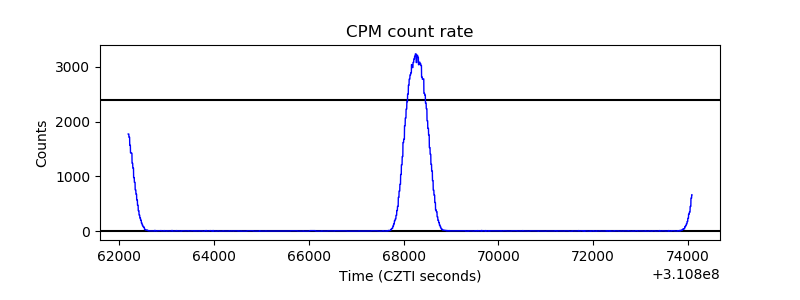 |
| CZT Counter | 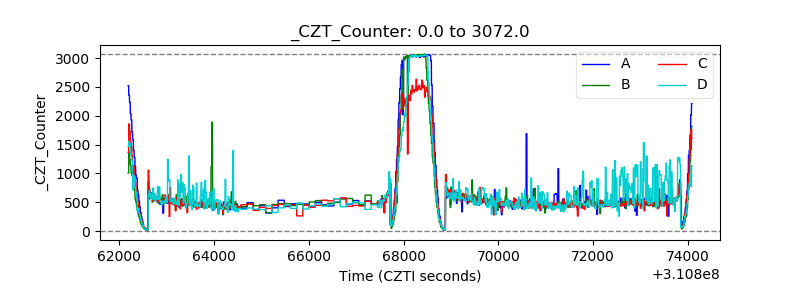 |
| +2.5 Volts monitor |  |
| +5 Volts monitor |  |
| _ROLL_ROT |  |
| _Roll_DEC |  |
| _Roll_RA |  |
| Veto Counter |  |