| Param | Original file | Final file |
|---|---|---|
| Filename | modeM0/AS1A07_054T01_9000003286cztM0_level2_bc.evt | modeM0/AS1A07_054T01_9000003286cztM0_level2_quad_clean.evt |
| Size (bytes) | 1,986,099,840 | 1,250,104,320 |
| Size | 1.8 GB | 1.2 GB |
| Events in quadrant A | 13,408,516 | 8,523,945 |
| Events in quadrant B | 13,781,258 | 8,585,525 |
| Events in quadrant C | 12,727,084 | 8,211,188 |
| Events in quadrant D | 15,770,315 | 8,064,349 |
| Mode M0 | |||
|---|---|---|---|
| Quadrant | BADHDUFLAG | Total packets | Discarded packets |
| A | 0 | 134113 | 0 |
| B | 0 | 134972 | 0 |
| C | 0 | 133898 | 0 |
| D | 0 | 140320 | 0 |
| Mode M9 | |||
|---|---|---|---|
| Quadrant | BADHDUFLAG | Total packets | Discarded packets |
| A | 0 | 88 | 0 |
| B | 0 | 89 | 0 |
| C | 0 | 89 | 0 |
| D | 0 | 89 | 0 |
| Mode SS | |||
|---|---|---|---|
| Quadrant | BADHDUFLAG | Total packets | Discarded packets |
| A | 0 | 1334 | 0 |
| B | 0 | 1334 | 0 |
| C | 0 | 1334 | 0 |
| D | 0 | 1334 | 0 |
| Quadrant | Total seconds | Saturated seconds | Saturation percentage |
|---|---|---|---|
| A | 65398 | 619 | 0.946512% |
| B | 65398 | 741 | 1.133062% |
| C | 65398 | 959 | 1.466406% |
| D | 65398 | 706 | 1.079544% |
Noise dominated data is calculated using 1-second bins in cleaned event files. If a bin has >2000 counts, and if more than 50% of those come from <1% of pixels, then it is considered to be noise-dominated and hence unusable.
| Quadrant | # 1 sec bins | Bins with >0 counts | Bins with >2000 counts | High rate bins dominated by noise | Noise dominated (total time) | Noise dominated (detector-on time) | Marked lightcurve |
|---|---|---|---|---|---|---|---|
| A | 97243 | 65402 | 3 | 3 | 0.00% | 0.00% |  |
| B | 97243 | 65399 | 1 | 1 | 0.00% | 0.00% |  |
| C | 97243 | 65399 | 0 | 0 | 0.00% | 0.00% | 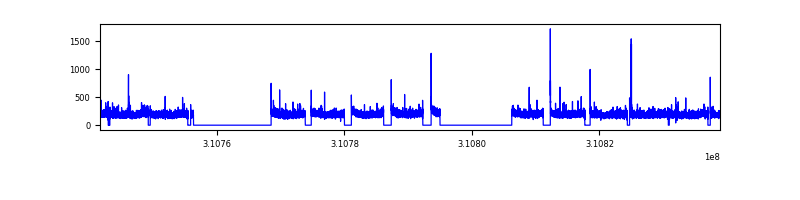 |
| D | 97243 | 65400 | 84 | 84 | 0.09% | 0.13% |  |
Top three noisy pixels from each quadrant. If the there are fewer than three noisy pixels in the level2.evt file, extra rows are filled as -1
| Pixel properties | Quadrant properties | ||||||
|---|---|---|---|---|---|---|---|
| Quadrant | DetID | PixID | Counts | Sigma | Mean | Median | Sigma |
| A | 2 | 79 | 175626 | 231.1 | 3418 | 3356 | 745.4 |
| A | 13 | 254 | 99736 | 129.29 | 3418 | 3356 | 745.4 |
| A | 5 | 168 | 50550 | 63.31 | 3418 | 3356 | 745.4 |
| B | 0 | 245 | 252342 | 382.44 | 3428 | 3346 | 651.1 |
| B | 0 | 219 | 114242 | 170.33 | 3428 | 3346 | 651.1 |
| B | 0 | 190 | 105428 | 156.79 | 3428 | 3346 | 651.1 |
| C | 0 | 10 | 54452 | 66.46 | 3269 | 3251 | 770.4 |
| C | 10 | 22 | 50742 | 61.64 | 3269 | 3251 | 770.4 |
| C | 10 | 91 | 39999 | 47.7 | 3269 | 3251 | 770.4 |
| D | 1 | 52 | 997660 | 1274.46 | 3352 | 3244 | 780.3 |
| D | 12 | 227 | 506320 | 644.75 | 3352 | 3244 | 780.3 |
| D | 2 | 136 | 294933 | 373.83 | 3352 | 3244 | 780.3 |
Histogram calculated using DETX and DETY for each event in the final _common_clean file
| Quadrant A |  |
 |
Quadrant B |
|---|---|---|---|
| Quadrant D |  |
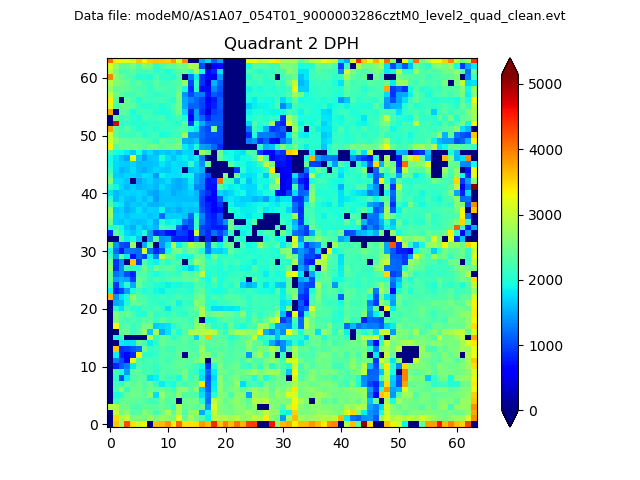 |
Quadrant C |
| Plot type | Count rate plots | Images |
|---|---|---|
| Comparison with Poisson distribution Blue bars denote a histogram of data divided into 1 sec bins. Red curve is a Poisson curve with rate = median count rate of data. |
 |
 |
| Quadrant-wise count rates Data is divided into 100 sec bins |
 |
|
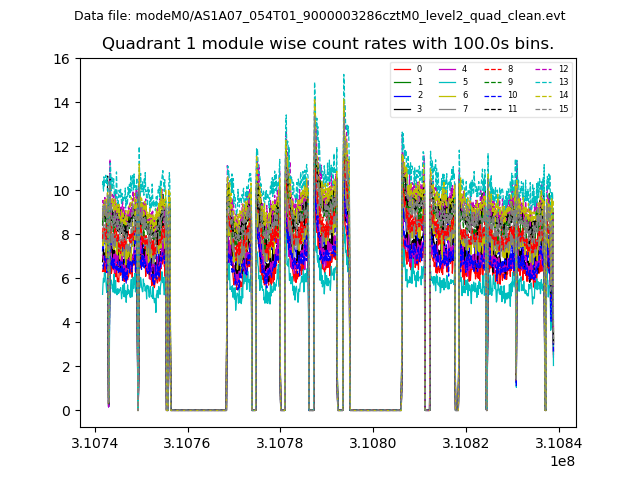
| Module-wise count rates for Quadrant A Data is divided into 100 sec bins |
 |
 |
| Module-wise count rates for Quadrant B Data is divided into 100 sec bins |
 |
 |
| Module-wise count rates for Quadrant C Data is divided into 100 sec bins |
 |
 |
| Module-wise count rates for Quadrant D Data is divided into 100 sec bins |
 |
 |
| Parameter | Plot |
|---|---|
| CZT HV Monitor |  |
| D_VDD |  |
| Temperature 1 |  |
| Veto HV Monitor |  |
| Veto LLD |  |
| Alpha Counter |  |
| _CPM_Rate |  |
| CZT Counter |  |
| +2.5 Volts monitor |  |
| +5 Volts monitor |  |
| _ROLL_ROT |  |
| _Roll_DEC |  |
| _Roll_RA |  |
| Veto Counter |  |