| Param | Original file | Final file |
|---|---|---|
| Filename | modeM0/AS1T03_145T01_9000003278cztM0_level2_bc.evt | modeM0/AS1T03_145T01_9000003278cztM0_level2_quad_clean.evt |
| Size (bytes) | 6,985,543,680 | 2,560,415,040 |
| Size | 6.5 GB | 2.4 GB |
| Events in quadrant A | 41,172,314 | 16,520,899 |
| Events in quadrant B | 43,934,323 | 16,762,871 |
| Events in quadrant C | 41,041,017 | 16,025,077 |
| Events in quadrant D | 72,366,745 | 15,124,311 |
| Mode M0 | |||
|---|---|---|---|
| Quadrant | BADHDUFLAG | Total packets | Discarded packets |
| A | 0 | 399180 | 0 |
| B | 0 | 408718 | 0 |
| C | 0 | 407067 | 0 |
| D | 0 | 521495 | 0 |
| Mode SS | |||
|---|---|---|---|
| Quadrant | BADHDUFLAG | Total packets | Discarded packets |
| A | 0 | 3898 | 0 |
| B | 0 | 3898 | 0 |
| C | 0 | 3898 | 0 |
| D | 0 | 3898 | 0 |
| Mode M9 | |||
|---|---|---|---|
| Quadrant | BADHDUFLAG | Total packets | Discarded packets |
| A | 0 | 332 | 0 |
| B | 0 | 333 | 0 |
| C | 0 | 333 | 0 |
| D | 0 | 333 | 0 |
| Quadrant | Total seconds | Saturated seconds | Saturation percentage |
|---|---|---|---|
| A | 191569 | 2031 | 1.060192% |
| B | 191568 | 2845 | 1.485112% |
| C | 191568 | 3310 | 1.727846% |
| D | 191567 | 13284 | 6.934388% |
Noise dominated data is calculated using 1-second bins in cleaned event files. If a bin has >2000 counts, and if more than 50% of those come from <1% of pixels, then it is considered to be noise-dominated and hence unusable.
| Quadrant | # 1 sec bins | Bins with >0 counts | Bins with >2000 counts | High rate bins dominated by noise | Noise dominated (total time) | Noise dominated (detector-on time) | Marked lightcurve |
|---|---|---|---|---|---|---|---|
| A | 235152 | 191579 | 3 | 3 | 0.00% | 0.00% |  |
| B | 235151 | 191575 | 64 | 64 | 0.03% | 0.03% |  |
| C | 235151 | 191580 | 17 | 17 | 0.01% | 0.01% | 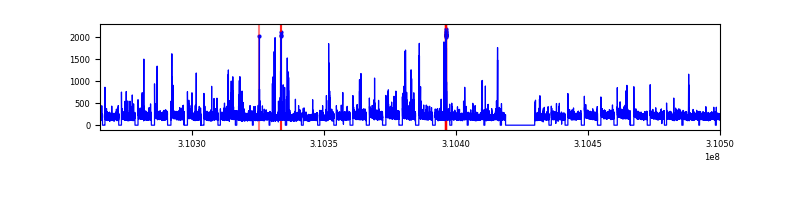 |
| D | 235151 | 191565 | 2304 | 2304 | 0.98% | 1.20% |  |
Top three noisy pixels from each quadrant. If the there are fewer than three noisy pixels in the level2.evt file, extra rows are filled as -1
| Pixel properties | Quadrant properties | ||||||
|---|---|---|---|---|---|---|---|
| Quadrant | DetID | PixID | Counts | Sigma | Mean | Median | Sigma |
| A | 13 | 254 | 309085 | 132.07 | 10597 | 10440 | 2261.3 |
| A | 5 | 16 | 137964 | 56.39 | 10597 | 10440 | 2261.3 |
| A | 3 | 1 | 116551 | 46.92 | 10597 | 10440 | 2261.3 |
| B | 3 | 64 | 1307234 | 657.26 | 10714 | 10481 | 1973.0 |
| B | 10 | 246 | 681338 | 340.03 | 10714 | 10481 | 1973.0 |
| B | 0 | 197 | 288129 | 140.73 | 10714 | 10481 | 1973.0 |
| C | 10 | 22 | 918879 | 381.82 | 10236 | 10230 | 2379.8 |
| C | 9 | 54 | 548640 | 226.24 | 10236 | 10230 | 2379.8 |
| C | 3 | 9 | 144663 | 56.49 | 10236 | 10230 | 2379.8 |
| D | 1 | 52 | 26031130 | 11232.65 | 10129 | 9813 | 2316.6 |
| D | 11 | 176 | 1517697 | 650.91 | 10129 | 9813 | 2316.6 |
| D | 2 | 133 | 1353577 | 580.06 | 10129 | 9813 | 2316.6 |
Histogram calculated using DETX and DETY for each event in the final _common_clean file
| Quadrant A |  |
 |
Quadrant B |
|---|---|---|---|
| Quadrant D |  |
 |
Quadrant C |
| Plot type | Count rate plots | Images |
|---|---|---|
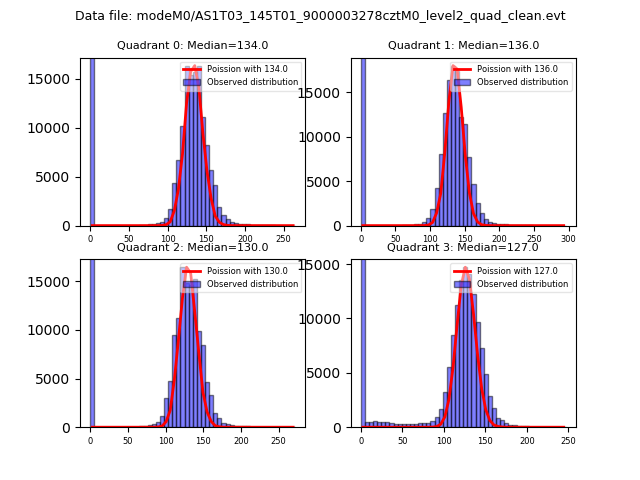
| Comparison with Poisson distribution Blue bars denote a histogram of data divided into 1 sec bins. Red curve is a Poisson curve with rate = median count rate of data. |
 |
 |
| Quadrant-wise count rates Data is divided into 100 sec bins |
 |
|
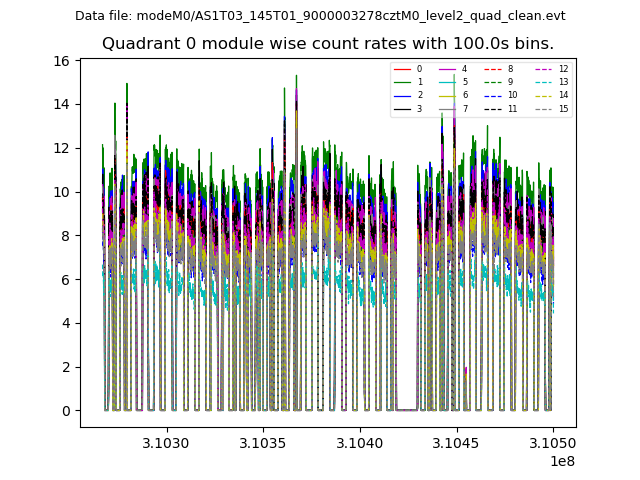
| Module-wise count rates for Quadrant A Data is divided into 100 sec bins |
 |
 |
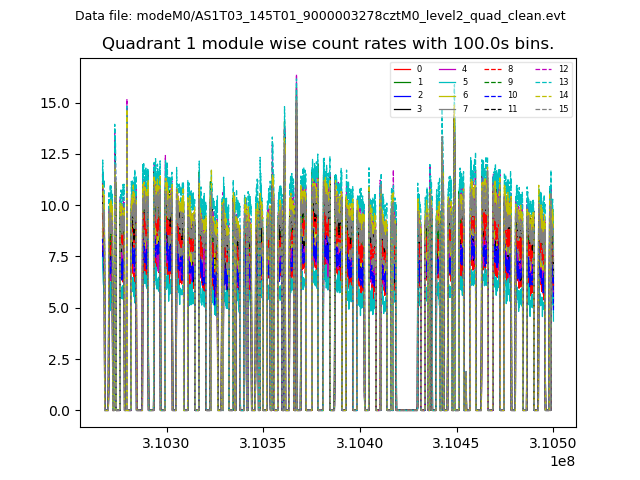
| Module-wise count rates for Quadrant B Data is divided into 100 sec bins |
 |
 |
| Module-wise count rates for Quadrant C Data is divided into 100 sec bins |
 |
 |
| Module-wise count rates for Quadrant D Data is divided into 100 sec bins |
 |
 |
| Parameter | Plot |
|---|---|
| CZT HV Monitor |  |
| D_VDD |  |
| Temperature 1 |  |
| Veto HV Monitor |  |
| Veto LLD | 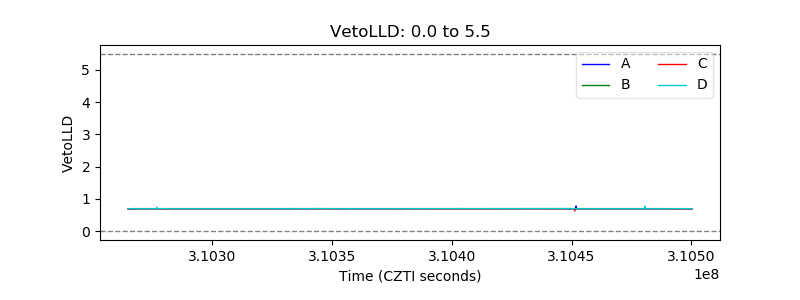 |
| Alpha Counter |  |
| _CPM_Rate |  |
| CZT Counter |  |
| +2.5 Volts monitor |  |
| +5 Volts monitor |  |
| _ROLL_ROT | 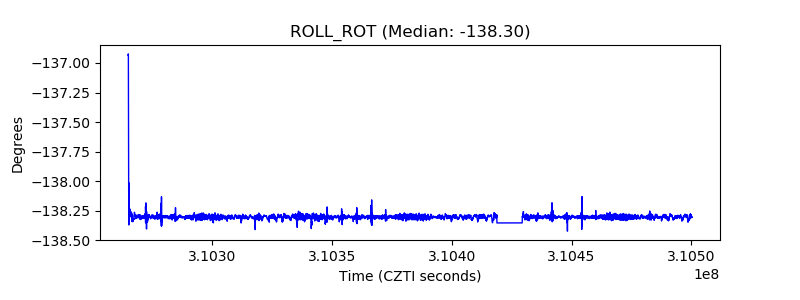 |
| _Roll_DEC |  |
| _Roll_RA |  |
| Veto Counter | 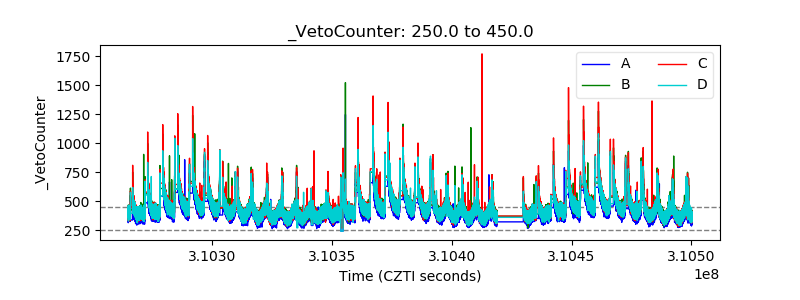 |