| Param | Original file | Final file |
|---|---|---|
| Filename | modeM0/AS1A07_007T04_9000003276cztM0_level2_bc.evt | modeM0/AS1A07_007T04_9000003276cztM0_level2_quad_clean.evt |
| Size (bytes) | 4,363,459,200 | 1,590,972,480 |
| Size | 4.1 GB | 1.5 GB |
| Events in quadrant A | 25,816,615 | 10,343,037 |
| Events in quadrant B | 26,647,187 | 10,412,665 |
| Events in quadrant C | 24,432,810 | 9,944,106 |
| Events in quadrant D | 47,192,632 | 9,382,830 |
| Mode M9 | |||
|---|---|---|---|
| Quadrant | BADHDUFLAG | Total packets | Discarded packets |
| A | 0 | 185 | 0 |
| B | 0 | 185 | 0 |
| C | 0 | 185 | 0 |
| D | 0 | 185 | 0 |
| Mode M0 | |||
|---|---|---|---|
| Quadrant | BADHDUFLAG | Total packets | Discarded packets |
| A | 0 | 248701 | 0 |
| B | 0 | 252090 | 0 |
| C | 0 | 247565 | 0 |
| D | 0 | 335405 | 0 |
| Mode SS | |||
|---|---|---|---|
| Quadrant | BADHDUFLAG | Total packets | Discarded packets |
| A | 0 | 2404 | 0 |
| B | 0 | 2404 | 0 |
| C | 0 | 2404 | 0 |
| D | 0 | 2404 | 0 |
| Quadrant | Total seconds | Saturated seconds | Saturation percentage |
|---|---|---|---|
| A | 118330 | 1450 | 1.225387% |
| B | 118331 | 1839 | 1.554115% |
| C | 118330 | 1967 | 1.662300% |
| D | 118331 | 8437 | 7.130000% |
Noise dominated data is calculated using 1-second bins in cleaned event files. If a bin has >2000 counts, and if more than 50% of those come from <1% of pixels, then it is considered to be noise-dominated and hence unusable.
| Quadrant | # 1 sec bins | Bins with >0 counts | Bins with >2000 counts | High rate bins dominated by noise | Noise dominated (total time) | Noise dominated (detector-on time) | Marked lightcurve |
|---|---|---|---|---|---|---|---|
| A | 136351 | 118340 | 139 | 139 | 0.10% | 0.12% |  |
| B | 136351 | 118335 | 73 | 73 | 0.05% | 0.06% |  |
| C | 136351 | 118335 | 47 | 47 | 0.03% | 0.04% |  |
| D | 136351 | 118332 | 782 | 782 | 0.57% | 0.66% |  |
Top three noisy pixels from each quadrant. If the there are fewer than three noisy pixels in the level2.evt file, extra rows are filled as -1
| Pixel properties | Quadrant properties | ||||||
|---|---|---|---|---|---|---|---|
| Quadrant | DetID | PixID | Counts | Sigma | Mean | Median | Sigma |
| A | 5 | 16 | 1058407 | 763.02 | 6383 | 6268 | 1378.9 |
| A | 13 | 254 | 202377 | 142.22 | 6383 | 6268 | 1378.9 |
| A | 4 | 2 | 64602 | 42.3 | 6383 | 6268 | 1378.9 |
| B | 3 | 64 | 1215954 | 1016.12 | 6398 | 6253 | 1190.5 |
| B | 0 | 230 | 286396 | 235.31 | 6398 | 6253 | 1190.5 |
| B | 10 | 246 | 192402 | 156.36 | 6398 | 6253 | 1190.5 |
| C | 10 | 22 | 818686 | 565.44 | 6114 | 6090 | 1437.1 |
| C | 5 | 4 | 51692 | 31.73 | 6114 | 6090 | 1437.1 |
| C | 13 | 61 | 35665 | 20.58 | 6114 | 6090 | 1437.1 |
| D | 2 | 133 | 8107957 | 5749.16 | 6070 | 5862 | 1409.3 |
| D | 1 | 52 | 6910372 | 4899.36 | 6070 | 5862 | 1409.3 |
| D | 11 | 176 | 3674564 | 2603.27 | 6070 | 5862 | 1409.3 |
Histogram calculated using DETX and DETY for each event in the final _common_clean file
| Quadrant A | 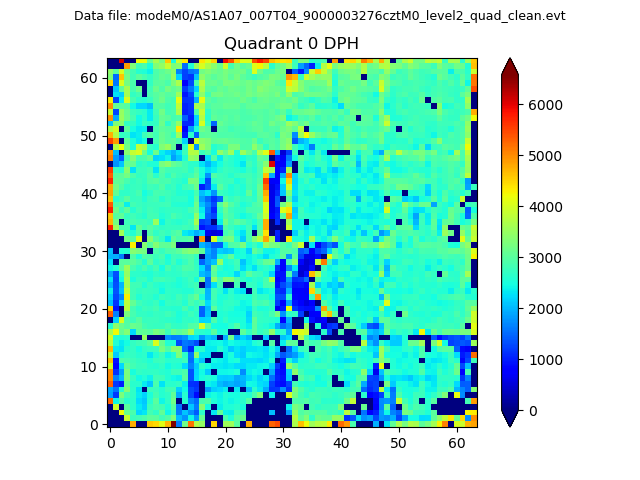 |
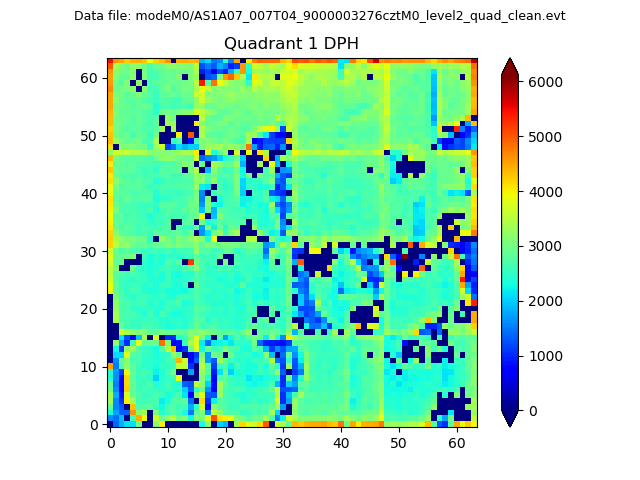 |
Quadrant B |
|---|---|---|---|
| Quadrant D |  |
 |
Quadrant C |
| Plot type | Count rate plots | Images |
|---|---|---|
| Comparison with Poisson distribution Blue bars denote a histogram of data divided into 1 sec bins. Red curve is a Poisson curve with rate = median count rate of data. |
 |
 |
| Quadrant-wise count rates Data is divided into 100 sec bins |
 |
|
| Module-wise count rates for Quadrant A Data is divided into 100 sec bins |
 |
 |
| Module-wise count rates for Quadrant B Data is divided into 100 sec bins |
 |
 |
| Module-wise count rates for Quadrant C Data is divided into 100 sec bins |
 |
 |
| Module-wise count rates for Quadrant D Data is divided into 100 sec bins |
 |
 |
| Parameter | Plot |
|---|---|
| CZT HV Monitor | 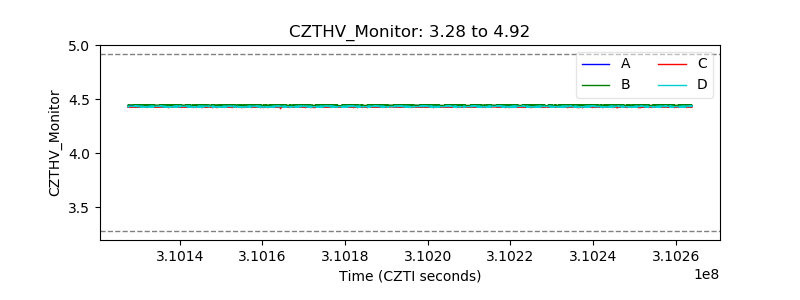 |
| D_VDD |  |
| Temperature 1 |  |
| Veto HV Monitor |  |
| Veto LLD |  |
| Alpha Counter |  |
| _CPM_Rate | 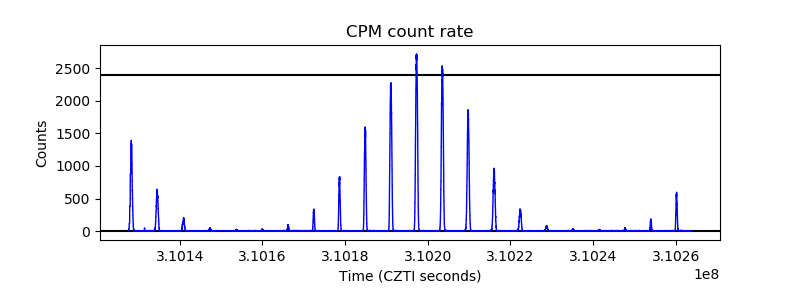 |
| CZT Counter | 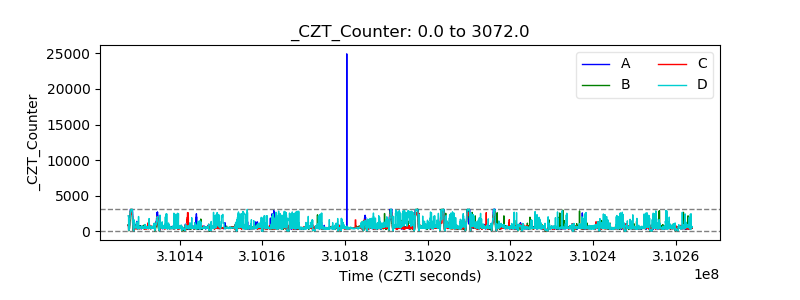 |
| +2.5 Volts monitor |  |
| +5 Volts monitor | 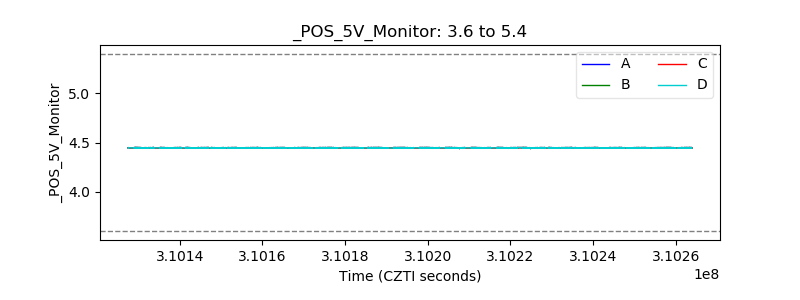 |
| _ROLL_ROT |  |
| _Roll_DEC |  |
| _Roll_RA | 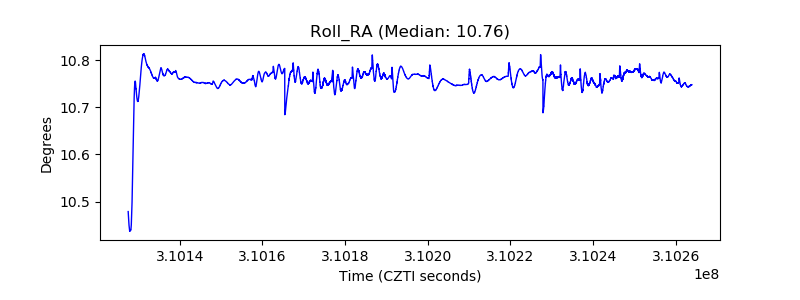 |
| Veto Counter |  |