| Param | Original file | Final file |
|---|---|---|
| Filename | modeM0/AS1T03_146T01_9000003272cztM0_level2_bc.evt | modeM0/AS1T03_146T01_9000003272cztM0_level2_quad_clean.evt |
| Size (bytes) | 2,120,376,960 | 741,384,000 |
| Size | 2.0 GB | 707.0 MB |
| Events in quadrant A | 11,638,928 | 4,920,896 |
| Events in quadrant B | 12,546,933 | 4,975,421 |
| Events in quadrant C | 12,536,973 | 4,660,518 |
| Events in quadrant D | 24,004,409 | 4,386,322 |
| Mode SS | |||
|---|---|---|---|
| Quadrant | BADHDUFLAG | Total packets | Discarded packets |
| A | 0 | 1046 | 0 |
| B | 0 | 1046 | 0 |
| C | 0 | 1046 | 0 |
| D | 0 | 1046 | 0 |
| Mode M9 | |||
|---|---|---|---|
| Quadrant | BADHDUFLAG | Total packets | Discarded packets |
| A | 0 | 100 | 0 |
| B | 0 | 100 | 0 |
| C | 0 | 100 | 0 |
| D | 0 | 100 | 0 |
| Mode M0 | |||
|---|---|---|---|
| Quadrant | BADHDUFLAG | Total packets | Discarded packets |
| A | 0 | 109572 | 0 |
| B | 0 | 112789 | 0 |
| C | 0 | 114121 | 0 |
| D | 0 | 156017 | 0 |
| Quadrant | Total seconds | Saturated seconds | Saturation percentage |
|---|---|---|---|
| A | 51188 | 735 | 1.435883% |
| B | 51188 | 974 | 1.902790% |
| C | 51188 | 941 | 1.838321% |
| D | 51188 | 3811 | 7.445104% |
Noise dominated data is calculated using 1-second bins in cleaned event files. If a bin has >2000 counts, and if more than 50% of those come from <1% of pixels, then it is considered to be noise-dominated and hence unusable.
| Quadrant | # 1 sec bins | Bins with >0 counts | Bins with >2000 counts | High rate bins dominated by noise | Noise dominated (total time) | Noise dominated (detector-on time) | Marked lightcurve |
|---|---|---|---|---|---|---|---|
| A | 61323 | 51192 | 3 | 3 | 0.00% | 0.01% |  |
| B | 61323 | 51189 | 39 | 39 | 0.06% | 0.08% |  |
| C | 61323 | 51191 | 3 | 3 | 0.00% | 0.01% |  |
| D | 61323 | 51190 | 588 | 588 | 0.96% | 1.15% |  |
Top three noisy pixels from each quadrant. If the there are fewer than three noisy pixels in the level2.evt file, extra rows are filled as -1
| Pixel properties | Quadrant properties | ||||||
|---|---|---|---|---|---|---|---|
| Quadrant | DetID | PixID | Counts | Sigma | Mean | Median | Sigma |
| A | 14 | 235 | 178263 | 279.84 | 2921 | 2876 | 626.7 |
| A | 15 | 174 | 153622 | 240.53 | 2921 | 2876 | 626.7 |
| A | 13 | 254 | 83003 | 127.85 | 2921 | 2876 | 626.7 |
| B | 3 | 64 | 594942 | 1076.5 | 2941 | 2878 | 550.0 |
| B | 0 | 197 | 175931 | 314.65 | 2941 | 2878 | 550.0 |
| B | 0 | 190 | 142560 | 253.97 | 2941 | 2878 | 550.0 |
| C | 0 | 239 | 1730338 | 2667.88 | 2750 | 2737 | 647.6 |
| C | 9 | 54 | 110848 | 166.95 | 2750 | 2737 | 647.6 |
| C | 10 | 22 | 102761 | 154.46 | 2750 | 2737 | 647.6 |
| D | 1 | 52 | 11866929 | 18576.49 | 2748 | 2659 | 638.7 |
| D | 2 | 16 | 465000 | 723.91 | 2748 | 2659 | 638.7 |
| D | 13 | 172 | 287089 | 445.35 | 2748 | 2659 | 638.7 |
Histogram calculated using DETX and DETY for each event in the final _common_clean file
| Quadrant A |  |
 |
Quadrant B |
|---|---|---|---|
| Quadrant D |  |
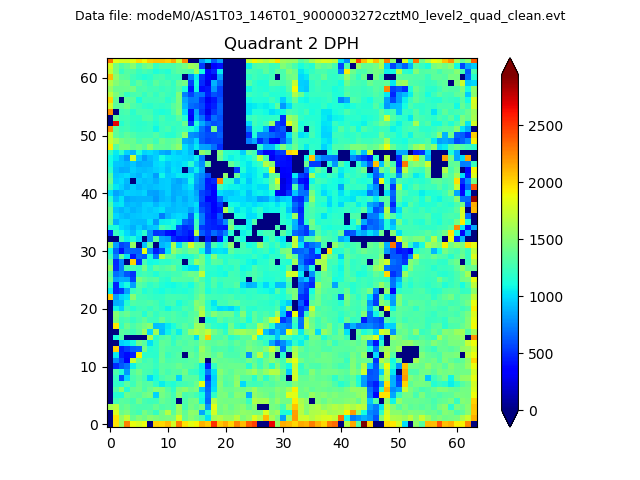 |
Quadrant C |
| Plot type | Count rate plots | Images |
|---|---|---|
| Comparison with Poisson distribution Blue bars denote a histogram of data divided into 1 sec bins. Red curve is a Poisson curve with rate = median count rate of data. |
 |
 |
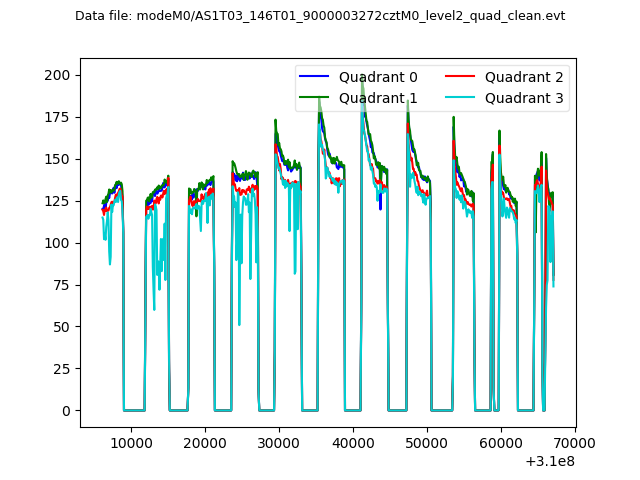
| Quadrant-wise count rates Data is divided into 100 sec bins |
 |
|
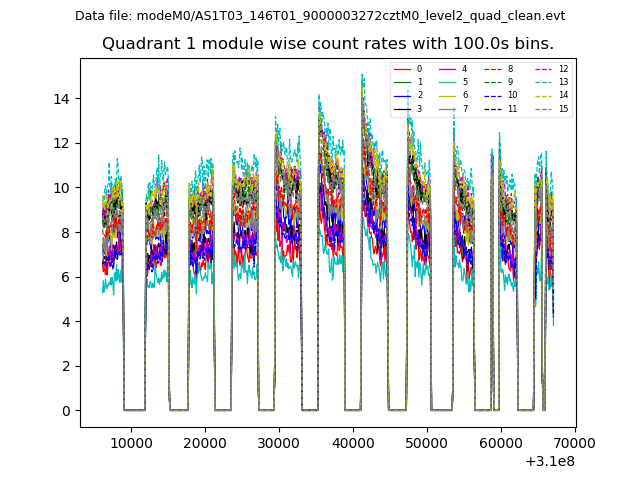
| Module-wise count rates for Quadrant A Data is divided into 100 sec bins |
 |
 |
| Module-wise count rates for Quadrant B Data is divided into 100 sec bins |
 |
 |
| Module-wise count rates for Quadrant C Data is divided into 100 sec bins |
 |
 |
| Module-wise count rates for Quadrant D Data is divided into 100 sec bins |
 |
 |
| Parameter | Plot |
|---|---|
| CZT HV Monitor |  |
| D_VDD |  |
| Temperature 1 |  |
| Veto HV Monitor | 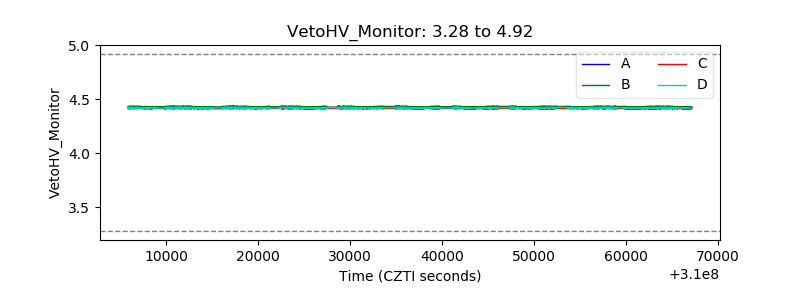 |
| Veto LLD |  |
| Alpha Counter |  |
| _CPM_Rate | 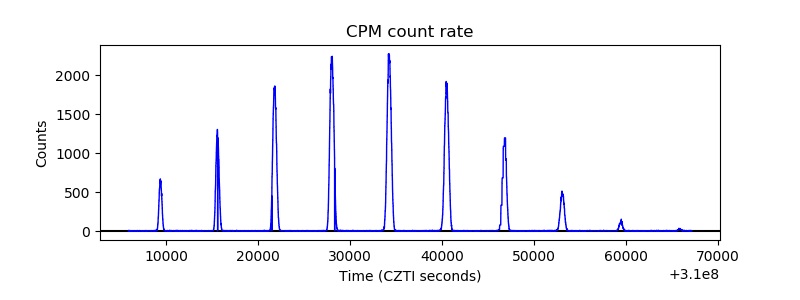 |
| CZT Counter |  |
| +2.5 Volts monitor |  |
| +5 Volts monitor |  |
| _ROLL_ROT |  |
| _Roll_DEC |  |
| _Roll_RA |  |
| Veto Counter |  |