| Param | Original file | Final file |
|---|---|---|
| Filename | modeM0/AS1A07_007T05_9000003274cztM0_level2_bc.evt | modeM0/AS1A07_007T05_9000003274cztM0_level2_quad_clean.evt |
| Size (bytes) | 1,955,646,720 | 667,385,280 |
| Size | 1.8 GB | 636.5 MB |
| Events in quadrant A | 10,898,318 | 4,296,330 |
| Events in quadrant B | 11,404,340 | 4,353,478 |
| Events in quadrant C | 10,730,513 | 4,135,943 |
| Events in quadrant D | 22,675,240 | 3,886,879 |
| Mode SS | |||
|---|---|---|---|
| Quadrant | BADHDUFLAG | Total packets | Discarded packets |
| A | 0 | 1050 | 0 |
| B | 0 | 1050 | 0 |
| C | 0 | 1050 | 0 |
| D | 0 | 1050 | 0 |
| Mode M9 | |||
|---|---|---|---|
| Quadrant | BADHDUFLAG | Total packets | Discarded packets |
| A | 0 | 76 | 0 |
| B | 0 | 76 | 0 |
| C | 0 | 76 | 0 |
| D | 0 | 76 | 0 |
| Mode M0 | |||
|---|---|---|---|
| Quadrant | BADHDUFLAG | Total packets | Discarded packets |
| A | 0 | 107176 | 0 |
| B | 0 | 108879 | 0 |
| C | 0 | 107783 | 0 |
| D | 0 | 144900 | 0 |
| Quadrant | Total seconds | Saturated seconds | Saturation percentage |
|---|---|---|---|
| A | 51605 | 315 | 0.610406% |
| B | 51605 | 461 | 0.893324% |
| C | 51605 | 591 | 1.145238% |
| D | 51605 | 3761 | 7.288053% |
Noise dominated data is calculated using 1-second bins in cleaned event files. If a bin has >2000 counts, and if more than 50% of those come from <1% of pixels, then it is considered to be noise-dominated and hence unusable.
| Quadrant | # 1 sec bins | Bins with >0 counts | Bins with >2000 counts | High rate bins dominated by noise | Noise dominated (total time) | Noise dominated (detector-on time) | Marked lightcurve |
|---|---|---|---|---|---|---|---|
| A | 59185 | 51605 | 0 | 0 | 0.00% | 0.00% |  |
| B | 59185 | 51606 | 12 | 12 | 0.02% | 0.02% |  |
| C | 59185 | 51608 | 1 | 1 | 0.00% | 0.00% |  |
| D | 59185 | 51606 | 1812 | 1812 | 3.06% | 3.51% |  |
Top three noisy pixels from each quadrant. If the there are fewer than three noisy pixels in the level2.evt file, extra rows are filled as -1
| Pixel properties | Quadrant properties | ||||||
|---|---|---|---|---|---|---|---|
| Quadrant | DetID | PixID | Counts | Sigma | Mean | Median | Sigma |
| A | 13 | 254 | 79020 | 126.27 | 2802 | 2755 | 604.0 |
| A | 15 | 174 | 50212 | 78.58 | 2802 | 2755 | 604.0 |
| A | 5 | 16 | 47479 | 74.05 | 2802 | 2755 | 604.0 |
| B | 3 | 64 | 246791 | 464.74 | 2819 | 2752 | 525.1 |
| B | 0 | 197 | 90205 | 166.54 | 2819 | 2752 | 525.1 |
| B | 0 | 190 | 87100 | 160.63 | 2819 | 2752 | 525.1 |
| C | 0 | 239 | 309976 | 487.48 | 2681 | 2675 | 630.4 |
| C | 10 | 22 | 96779 | 149.28 | 2681 | 2675 | 630.4 |
| C | 8 | 128 | 16939 | 22.63 | 2681 | 2675 | 630.4 |
| D | 1 | 52 | 10023940 | 16179.52 | 2678 | 2585 | 619.4 |
| D | 2 | 16 | 516768 | 830.15 | 2678 | 2585 | 619.4 |
| D | 2 | 136 | 466768 | 749.43 | 2678 | 2585 | 619.4 |
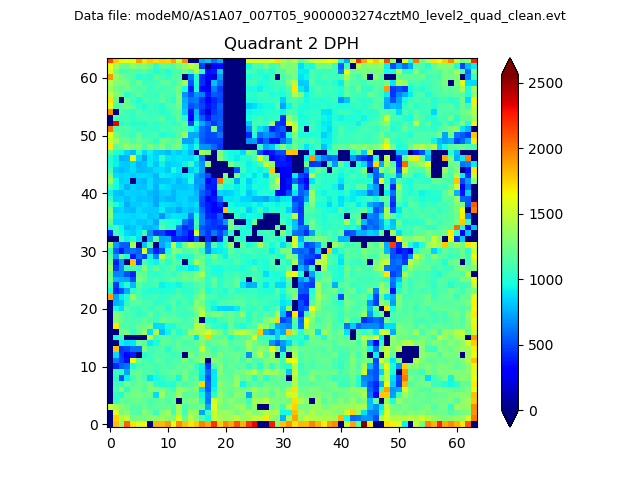
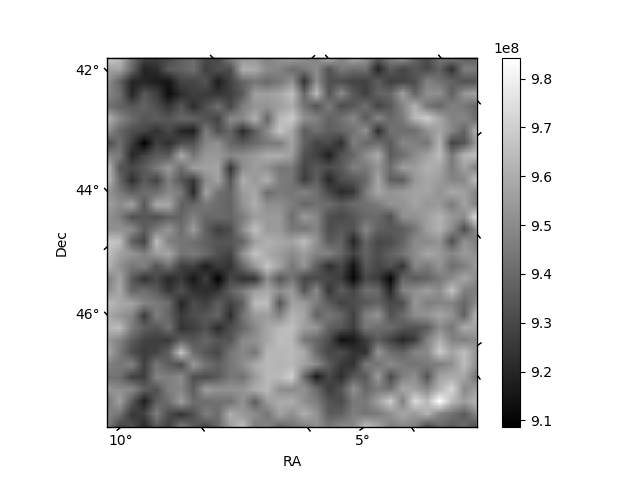
Histogram calculated using DETX and DETY for each event in the final _common_clean file
| Quadrant A |  |
 |
Quadrant B |
|---|---|---|---|
| Quadrant D | 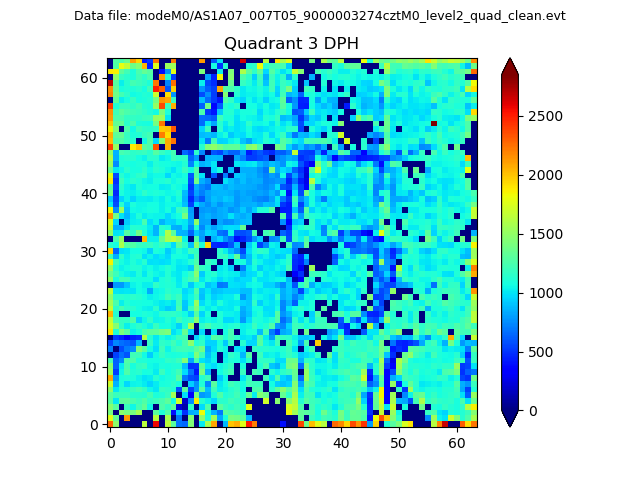 |
 |
Quadrant C |
| Plot type | Count rate plots | Images |
|---|---|---|
| Comparison with Poisson distribution Blue bars denote a histogram of data divided into 1 sec bins. Red curve is a Poisson curve with rate = median count rate of data. |
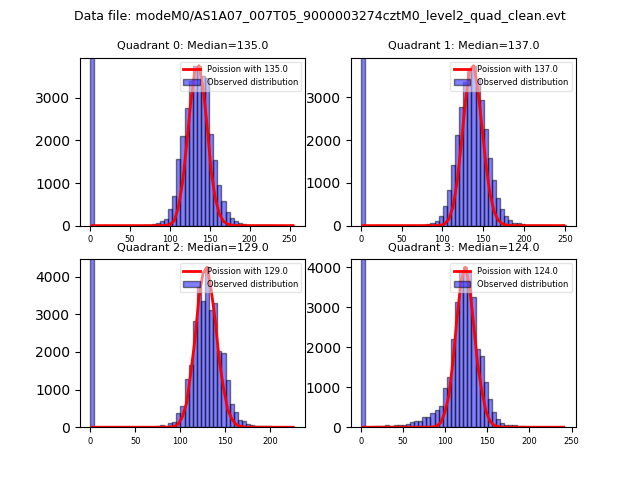 |
 |
| Quadrant-wise count rates Data is divided into 100 sec bins |
 |
|
| Module-wise count rates for Quadrant A Data is divided into 100 sec bins |
 |
 |
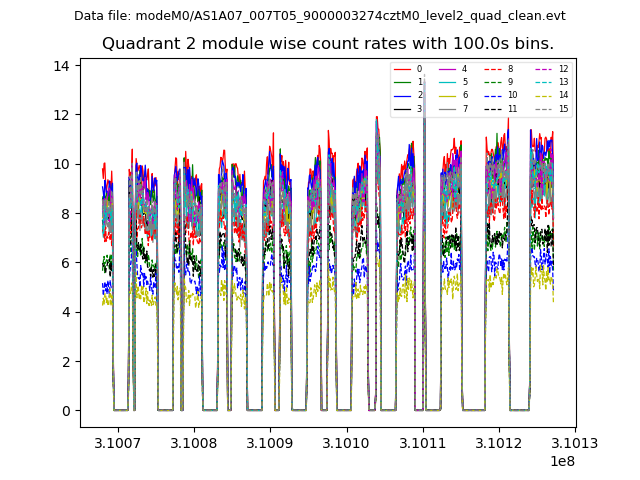
| Module-wise count rates for Quadrant B Data is divided into 100 sec bins |
 |
 |
| Module-wise count rates for Quadrant C Data is divided into 100 sec bins |
 |
 |
| Module-wise count rates for Quadrant D Data is divided into 100 sec bins |
 |
 |
| Parameter | Plot |
|---|---|
| CZT HV Monitor |  |
| D_VDD | 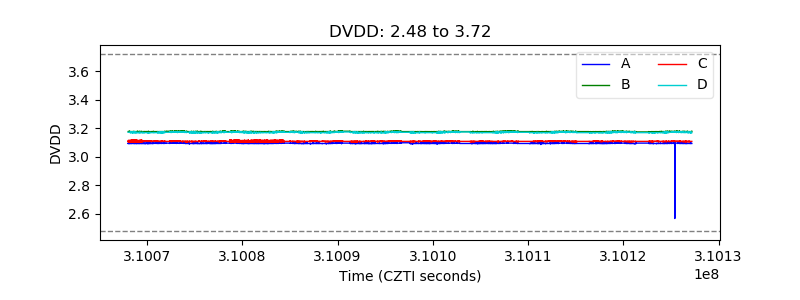 |
| Temperature 1 |  |
| Veto HV Monitor | 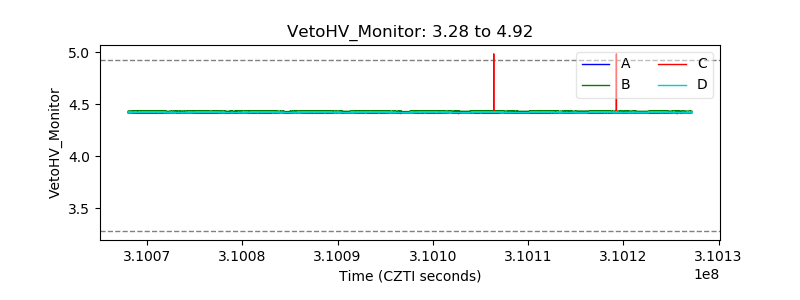 |
| Veto LLD |  |
| Alpha Counter | 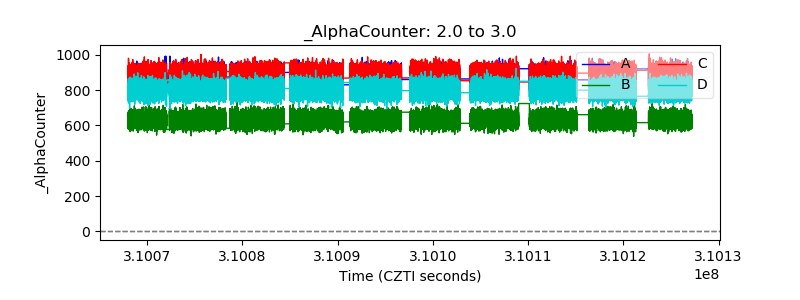 |
| _CPM_Rate |  |
| CZT Counter |  |
| +2.5 Volts monitor |  |
| +5 Volts monitor | 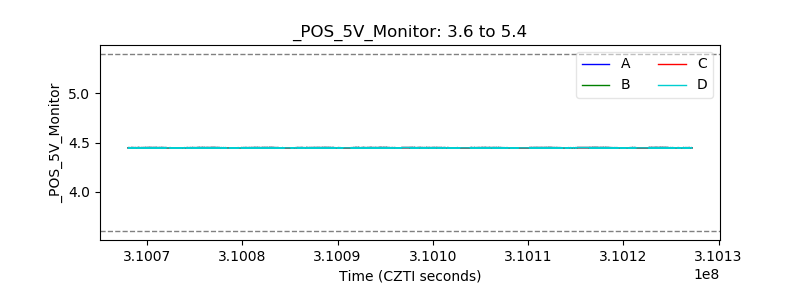 |
| _ROLL_ROT |  |
| _Roll_DEC |  |
| _Roll_RA |  |
| Veto Counter |  |