| Param | Original file | Final file |
|---|---|---|
| Filename | modeM0/AS1A07_047T09_9000003260cztM0_level2_bc.evt | modeM0/AS1A07_047T09_9000003260cztM0_level2_quad_clean.evt |
| Size (bytes) | 303,330,240 | 169,597,440 |
| Size | 289.3 MB | 161.7 MB |
| Events in quadrant A | 1,829,114 | 1,178,124 |
| Events in quadrant B | 2,041,739 | 1,192,046 |
| Events in quadrant C | 1,755,346 | 1,128,781 |
| Events in quadrant D | 3,014,964 | 1,089,503 |
| Mode M0 | |||
|---|---|---|---|
| Quadrant | BADHDUFLAG | Total packets | Discarded packets |
| A | 0 | 16831 | 0 |
| B | 0 | 17471 | 0 |
| C | 0 | 16822 | 0 |
| D | 0 | 21513 | 0 |
| Mode M9 | |||
|---|---|---|---|
| Quadrant | BADHDUFLAG | Total packets | Discarded packets |
| A | 0 | 26 | 0 |
| B | 0 | 26 | 0 |
| C | 0 | 26 | 0 |
| D | 0 | 26 | 0 |
| Mode SS | |||
|---|---|---|---|
| Quadrant | BADHDUFLAG | Total packets | Discarded packets |
| A | 0 | 160 | 0 |
| B | 0 | 160 | 0 |
| C | 0 | 160 | 0 |
| D | 0 | 160 | 0 |
| Quadrant | Total seconds | Saturated seconds | Saturation percentage |
|---|---|---|---|
| A | 7898 | 147 | 1.861231% |
| B | 7898 | 201 | 2.544948% |
| C | 7898 | 209 | 2.646240% |
| D | 7898 | 484 | 6.128134% |
Noise dominated data is calculated using 1-second bins in cleaned event files. If a bin has >2000 counts, and if more than 50% of those come from <1% of pixels, then it is considered to be noise-dominated and hence unusable.
| Quadrant | # 1 sec bins | Bins with >0 counts | Bins with >2000 counts | High rate bins dominated by noise | Noise dominated (total time) | Noise dominated (detector-on time) | Marked lightcurve |
|---|---|---|---|---|---|---|---|
| A | 10473 | 7896 | 0 | 0 | 0.00% | 0.00% |  |
| B | 10473 | 7896 | 3 | 3 | 0.03% | 0.04% |  |
| C | 10473 | 7896 | 0 | 0 | 0.00% | 0.00% |  |
| D | 10473 | 7896 | 49 | 49 | 0.47% | 0.62% |  |
Top three noisy pixels from each quadrant. If the there are fewer than three noisy pixels in the level2.evt file, extra rows are filled as -1
| Pixel properties | Quadrant properties | ||||||
|---|---|---|---|---|---|---|---|
| Quadrant | DetID | PixID | Counts | Sigma | Mean | Median | Sigma |
| A | 13 | 254 | 12174 | 114.12 | 474 | 469 | 102.6 |
| A | 3 | 1 | 3901 | 33.46 | 474 | 469 | 102.6 |
| A | 0 | 226 | 3068 | 25.34 | 474 | 469 | 102.6 |
| B | 3 | 64 | 118246 | 1305.86 | 475 | 467 | 90.2 |
| B | 0 | 190 | 33031 | 361.05 | 475 | 467 | 90.2 |
| B | 0 | 197 | 23579 | 256.25 | 475 | 467 | 90.2 |
| C | 10 | 22 | 18954 | 174.3 | 449 | 451 | 106.2 |
| C | 9 | 54 | 5832 | 50.69 | 449 | 451 | 106.2 |
| C | 0 | 10 | 3506 | 28.78 | 449 | 451 | 106.2 |
| D | 12 | 233 | 556320 | 5240.99 | 454 | 440 | 106.1 |
| D | 13 | 249 | 326833 | 3077.32 | 454 | 440 | 106.1 |
| D | 11 | 176 | 145855 | 1371.01 | 454 | 440 | 106.1 |
Histogram calculated using DETX and DETY for each event in the final _common_clean file
| Quadrant A |  |
 |
Quadrant B |
|---|---|---|---|
| Quadrant D |  |
 |
Quadrant C |
| Plot type | Count rate plots | Images |
|---|---|---|
| Comparison with Poisson distribution Blue bars denote a histogram of data divided into 1 sec bins. Red curve is a Poisson curve with rate = median count rate of data. |
 |
 |
| Quadrant-wise count rates Data is divided into 100 sec bins |
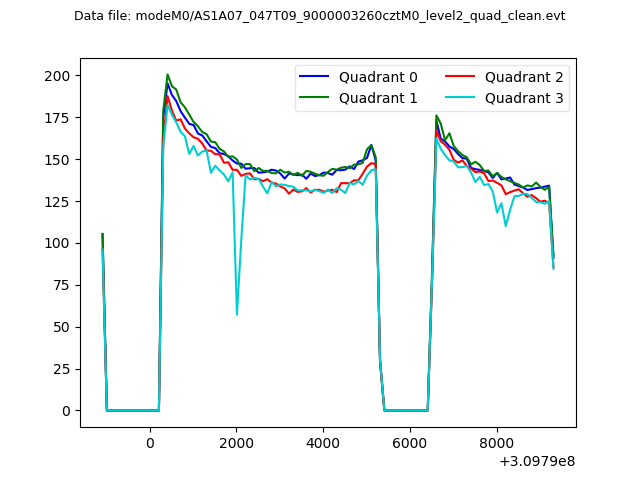 |
|
| Module-wise count rates for Quadrant A Data is divided into 100 sec bins |
 |
 |
| Module-wise count rates for Quadrant B Data is divided into 100 sec bins |
 |
 |
| Module-wise count rates for Quadrant C Data is divided into 100 sec bins |
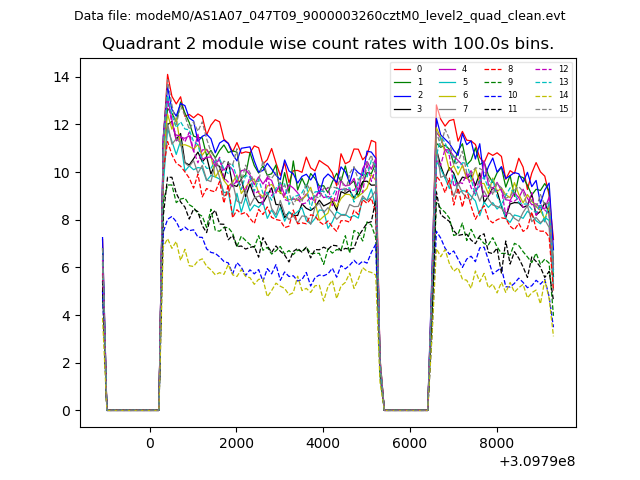 |
 |
| Module-wise count rates for Quadrant D Data is divided into 100 sec bins |
 |
 |
| Parameter | Plot |
|---|---|
| CZT HV Monitor | 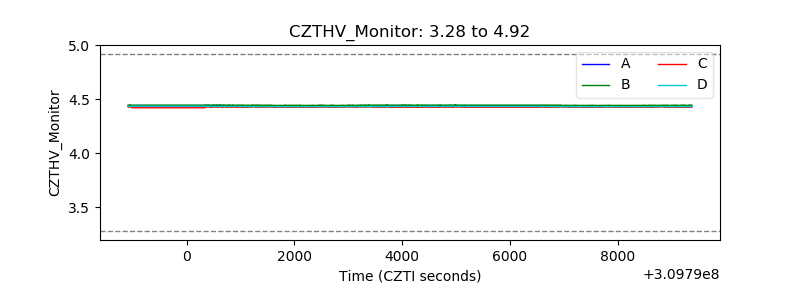 |
| D_VDD |  |
| Temperature 1 | 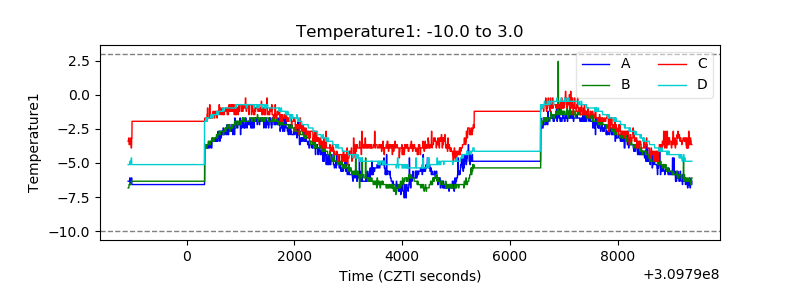 |
| Veto HV Monitor |  |
| Veto LLD |  |
| Alpha Counter |  |
| _CPM_Rate |  |
| CZT Counter | 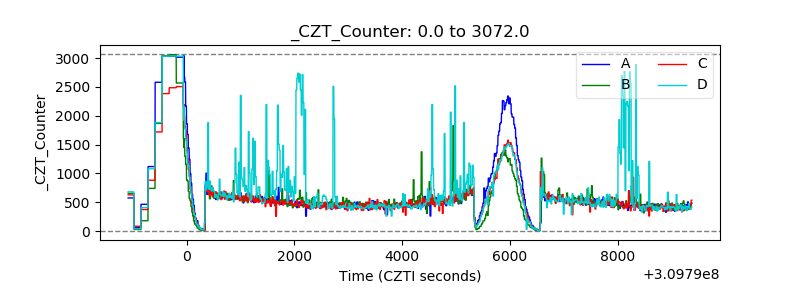 |
| +2.5 Volts monitor |  |
| +5 Volts monitor |  |
| _ROLL_ROT | 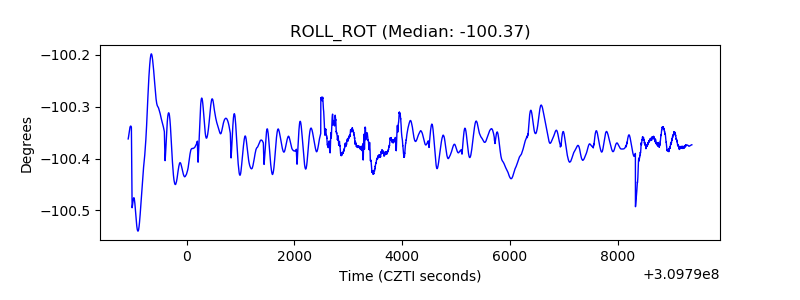 |
| _Roll_DEC |  |
| _Roll_RA |  |
| Veto Counter |  |