| Param | Original file | Final file |
|---|---|---|
| Filename | modeM0/AS1A07_094T01_9000003248cztM0_level2_bc.evt | modeM0/AS1A07_094T01_9000003248cztM0_level2_quad_clean.evt |
| Size (bytes) | 4,906,137,600 | 1,684,451,520 |
| Size | 4.6 GB | 1.6 GB |
| Events in quadrant A | 27,500,594 | 10,938,024 |
| Events in quadrant B | 31,109,982 | 10,959,913 |
| Events in quadrant C | 25,423,221 | 10,476,498 |
| Events in quadrant D | 55,977,874 | 10,018,278 |
| Mode SS | |||
|---|---|---|---|
| Quadrant | BADHDUFLAG | Total packets | Discarded packets |
| A | 0 | 2572 | 0 |
| B | 0 | 2572 | 0 |
| C | 0 | 2572 | 0 |
| D | 0 | 2572 | 0 |
| Mode M0 | |||
|---|---|---|---|
| Quadrant | BADHDUFLAG | Total packets | Discarded packets |
| A | 0 | 265831 | 0 |
| B | 0 | 280109 | 0 |
| C | 0 | 262583 | 0 |
| D | 0 | 364827 | 0 |
| Mode M9 | |||
|---|---|---|---|
| Quadrant | BADHDUFLAG | Total packets | Discarded packets |
| A | 0 | 187 | 0 |
| B | 0 | 187 | 0 |
| C | 0 | 187 | 0 |
| D | 0 | 187 | 0 |
| Quadrant | Total seconds | Saturated seconds | Saturation percentage |
|---|---|---|---|
| A | 125901 | 1439 | 1.142962% |
| B | 125901 | 2475 | 1.965830% |
| C | 125901 | 1843 | 1.463849% |
| D | 125901 | 7351 | 5.838715% |
Noise dominated data is calculated using 1-second bins in cleaned event files. If a bin has >2000 counts, and if more than 50% of those come from <1% of pixels, then it is considered to be noise-dominated and hence unusable.
| Quadrant | # 1 sec bins | Bins with >0 counts | Bins with >2000 counts | High rate bins dominated by noise | Noise dominated (total time) | Noise dominated (detector-on time) | Marked lightcurve |
|---|---|---|---|---|---|---|---|
| A | 144987 | 125890 | 7 | 7 | 0.00% | 0.01% |  |
| B | 144987 | 125885 | 163 | 163 | 0.11% | 0.13% |  |
| C | 144987 | 125888 | 0 | 0 | 0.00% | 0.00% |  |
| D | 144987 | 125890 | 1511 | 1511 | 1.04% | 1.20% |  |
Top three noisy pixels from each quadrant. If the there are fewer than three noisy pixels in the level2.evt file, extra rows are filled as -1
| Pixel properties | Quadrant properties | ||||||
|---|---|---|---|---|---|---|---|
| Quadrant | DetID | PixID | Counts | Sigma | Mean | Median | Sigma |
| A | 2 | 79 | 333568 | 218.16 | 6935 | 6813 | 1497.8 |
| A | 13 | 254 | 213390 | 137.92 | 6935 | 6813 | 1497.8 |
| A | 15 | 236 | 181435 | 116.59 | 6935 | 6813 | 1497.8 |
| B | 3 | 64 | 2364370 | 1831.67 | 6917 | 6751 | 1287.1 |
| B | 0 | 230 | 1012849 | 781.65 | 6917 | 6751 | 1287.1 |
| B | 0 | 190 | 339338 | 258.39 | 6917 | 6751 | 1287.1 |
| C | 9 | 54 | 41144 | 22.5 | 6585 | 6560 | 1537.2 |
| C | 13 | 61 | 38228 | 20.6 | 6585 | 6560 | 1537.2 |
| C | 0 | 10 | 34894 | 18.43 | 6585 | 6560 | 1537.2 |
| D | 7 | 238 | 16287788 | 10684.59 | 6650 | 6424 | 1523.8 |
| D | 1 | 52 | 6437206 | 4220.18 | 6650 | 6424 | 1523.8 |
| D | 5 | 222 | 2193791 | 1435.45 | 6650 | 6424 | 1523.8 |
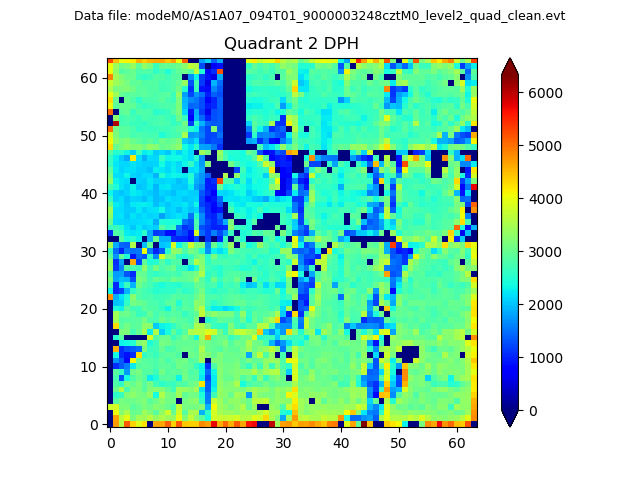
Histogram calculated using DETX and DETY for each event in the final _common_clean file
| Quadrant A |  |
 |
Quadrant B |
|---|---|---|---|
| Quadrant D |  |
 |
Quadrant C |
| Plot type | Count rate plots | Images |
|---|---|---|
| Comparison with Poisson distribution Blue bars denote a histogram of data divided into 1 sec bins. Red curve is a Poisson curve with rate = median count rate of data. |
 |
 |
| Quadrant-wise count rates Data is divided into 100 sec bins |
 |
|
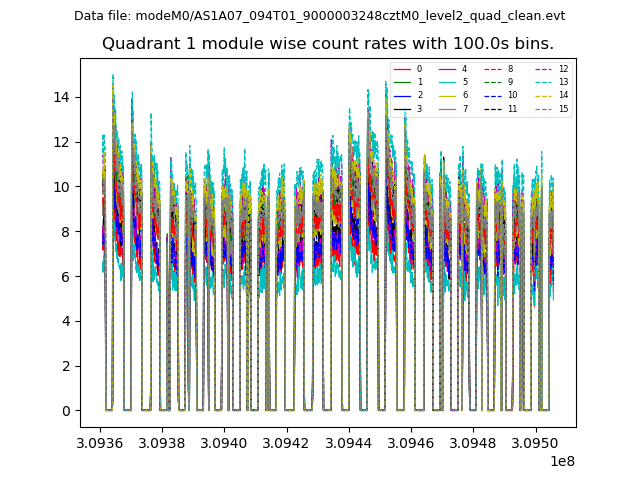
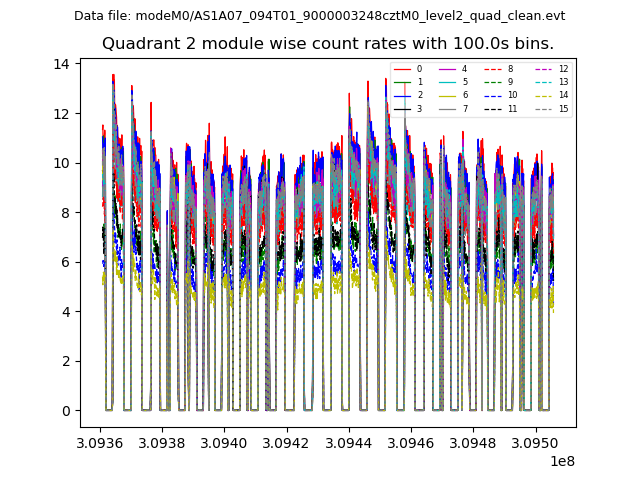
| Module-wise count rates for Quadrant A Data is divided into 100 sec bins |
 |
 |
| Module-wise count rates for Quadrant B Data is divided into 100 sec bins |
 |
 |
| Module-wise count rates for Quadrant C Data is divided into 100 sec bins |
 |
 |
| Module-wise count rates for Quadrant D Data is divided into 100 sec bins |
 |
 |
| Parameter | Plot |
|---|---|
| CZT HV Monitor |  |
| D_VDD |  |
| Temperature 1 | 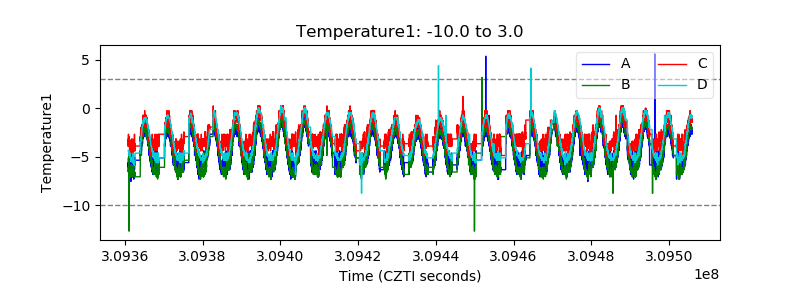 |
| Veto HV Monitor |  |
| Veto LLD | 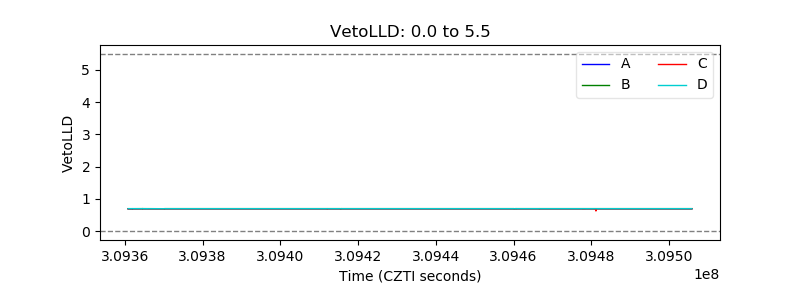 |
| Alpha Counter |  |
| _CPM_Rate | 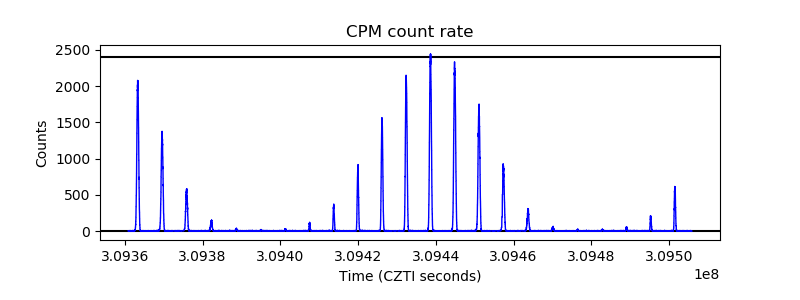 |
| CZT Counter |  |
| +2.5 Volts monitor | 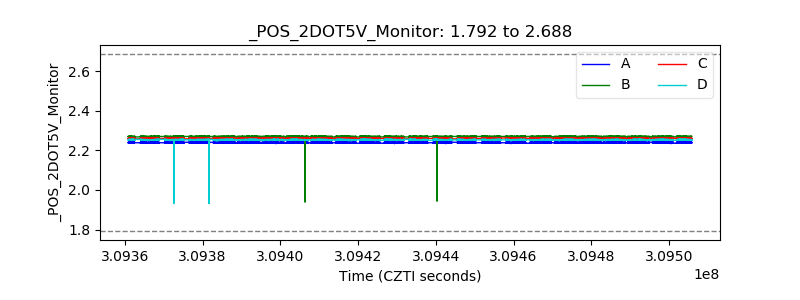 |
| +5 Volts monitor |  |
| _ROLL_ROT | 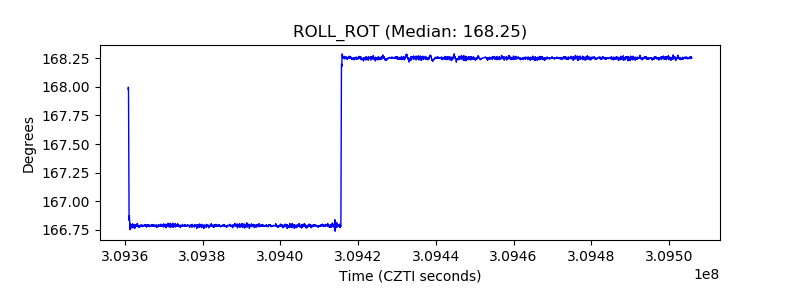 |
| _Roll_DEC |  |
| _Roll_RA |  |
| Veto Counter |  |