| Param | Original file | Final file |
|---|---|---|
| Filename | modeM0/AS1A07_007T02_9000003244cztM0_level2_bc.evt | modeM0/AS1A07_007T02_9000003244cztM0_level2_quad_clean.evt |
| Size (bytes) | 3,354,811,200 | 1,451,525,760 |
| Size | 3.1 GB | 1.4 GB |
| Events in quadrant A | 22,529,200 | 9,441,326 |
| Events in quadrant B | 24,614,809 | 9,534,326 |
| Events in quadrant C | 21,018,685 | 9,265,256 |
| Events in quadrant D | 26,740,730 | 8,991,386 |
| Mode M0 | |||
|---|---|---|---|
| Quadrant | BADHDUFLAG | Total packets | Discarded packets |
| A | 0 | 211103 | 0 |
| B | 0 | 218457 | 0 |
| C | 0 | 208584 | 0 |
| D | 0 | 225752 | 0 |
| Mode M9 | |||
|---|---|---|---|
| Quadrant | BADHDUFLAG | Total packets | Discarded packets |
| A | 0 | 186 | 0 |
| B | 0 | 186 | 0 |
| C | 0 | 186 | 0 |
| D | 0 | 186 | 0 |
| Mode SS | |||
|---|---|---|---|
| Quadrant | BADHDUFLAG | Total packets | Discarded packets |
| A | 0 | 2008 | 0 |
| B | 0 | 2008 | 0 |
| C | 0 | 2008 | 0 |
| D | 0 | 2008 | 0 |
| Quadrant | Total seconds | Saturated seconds | Saturation percentage |
|---|---|---|---|
| A | 98289 | 1170 | 1.190367% |
| B | 98289 | 2077 | 2.113156% |
| C | 98289 | 1657 | 1.685845% |
| D | 98289 | 2157 | 2.194549% |
Noise dominated data is calculated using 1-second bins in cleaned event files. If a bin has >2000 counts, and if more than 50% of those come from <1% of pixels, then it is considered to be noise-dominated and hence unusable.
| Quadrant | # 1 sec bins | Bins with >0 counts | Bins with >2000 counts | High rate bins dominated by noise | Noise dominated (total time) | Noise dominated (detector-on time) | Marked lightcurve |
|---|---|---|---|---|---|---|---|
| A | 116890 | 98276 | 4 | 4 | 0.00% | 0.00% |  |
| B | 116890 | 98273 | 172 | 172 | 0.15% | 0.18% |  |
| C | 116890 | 98277 | 6 | 6 | 0.01% | 0.01% |  |
| D | 116890 | 98279 | 128 | 128 | 0.11% | 0.13% | 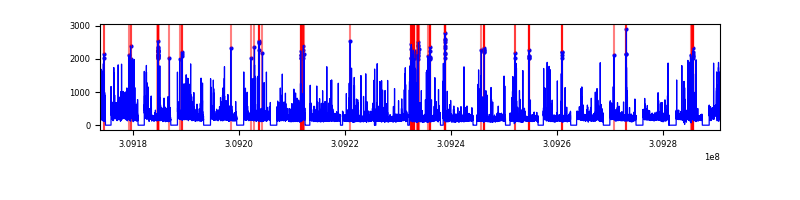 |
Top three noisy pixels from each quadrant. If the there are fewer than three noisy pixels in the level2.evt file, extra rows are filled as -1
| Pixel properties | Quadrant properties | ||||||
|---|---|---|---|---|---|---|---|
| Quadrant | DetID | PixID | Counts | Sigma | Mean | Median | Sigma |
| A | 2 | 79 | 880317 | 743.54 | 5565 | 5486 | 1176.6 |
| A | 13 | 254 | 151895 | 124.44 | 5565 | 5486 | 1176.6 |
| A | 4 | 2 | 146468 | 119.82 | 5565 | 5486 | 1176.6 |
| B | 3 | 64 | 2245496 | 2179.72 | 5578 | 5459 | 1027.7 |
| B | 0 | 230 | 337160 | 322.77 | 5578 | 5459 | 1027.7 |
| B | 0 | 197 | 325593 | 311.51 | 5578 | 5459 | 1027.7 |
| C | 10 | 22 | 109044 | 82.09 | 5422 | 5416 | 1262.3 |
| C | 9 | 54 | 43735 | 30.36 | 5422 | 5416 | 1262.3 |
| C | 13 | 61 | 31033 | 20.29 | 5422 | 5416 | 1262.3 |
| D | 1 | 52 | 1862954 | 1508.74 | 5483 | 5317 | 1231.3 |
| D | 13 | 174 | 1508242 | 1220.65 | 5483 | 5317 | 1231.3 |
| D | 12 | 235 | 931791 | 752.46 | 5483 | 5317 | 1231.3 |
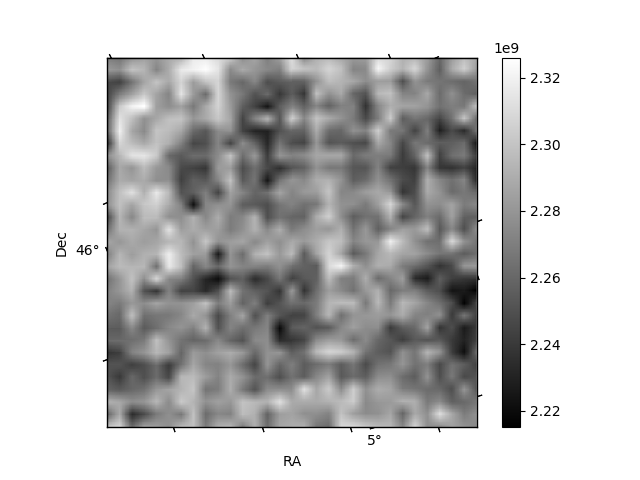
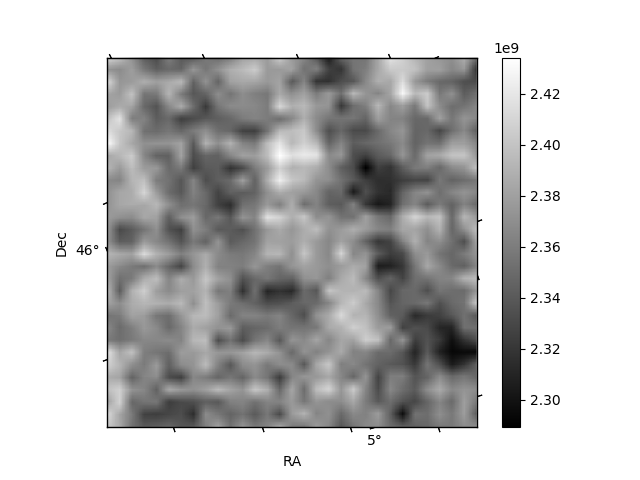
Histogram calculated using DETX and DETY for each event in the final _common_clean file
| Quadrant A |  |
 |
Quadrant B |
|---|---|---|---|
| Quadrant D |  |
 |
Quadrant C |
| Plot type | Count rate plots | Images |
|---|---|---|
| Comparison with Poisson distribution Blue bars denote a histogram of data divided into 1 sec bins. Red curve is a Poisson curve with rate = median count rate of data. |
 |
 |
| Quadrant-wise count rates Data is divided into 100 sec bins |
 |
|
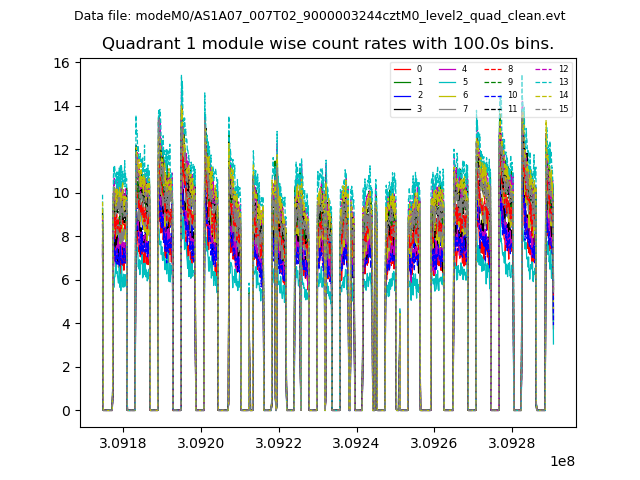
| Module-wise count rates for Quadrant A Data is divided into 100 sec bins |
 |
 |
| Module-wise count rates for Quadrant B Data is divided into 100 sec bins |
 |
 |
| Module-wise count rates for Quadrant C Data is divided into 100 sec bins |
 |
 |
| Module-wise count rates for Quadrant D Data is divided into 100 sec bins |
 |
 |
| Parameter | Plot |
|---|---|
| CZT HV Monitor |  |
| D_VDD |  |
| Temperature 1 |  |
| Veto HV Monitor |  |
| Veto LLD |  |
| Alpha Counter |  |
| _CPM_Rate |  |
| CZT Counter | 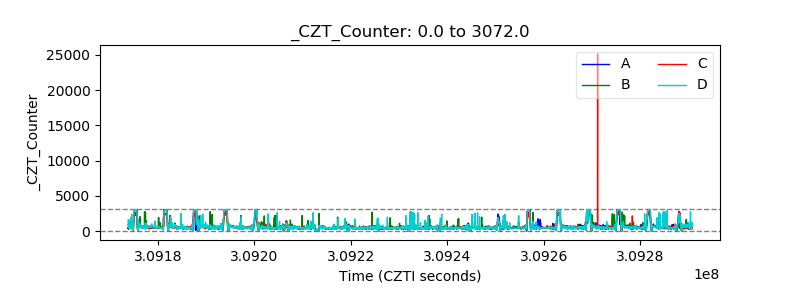 |
| +2.5 Volts monitor |  |
| +5 Volts monitor |  |
| _ROLL_ROT |  |
| _Roll_DEC |  |
| _Roll_RA |  |
| Veto Counter |  |