| Param | Original file | Final file |
|---|---|---|
| Filename | modeM0/AS1A07_100T03_9000003242cztM0_level2_bc.evt | modeM0/AS1A07_100T03_9000003242cztM0_level2_quad_clean.evt |
| Size (bytes) | 6,378,992,640 | 2,794,775,040 |
| Size | 5.9 GB | 2.6 GB |
| Events in quadrant A | 38,610,331 | 18,915,733 |
| Events in quadrant B | 44,424,163 | 19,008,859 |
| Events in quadrant C | 31,419,134 | 18,807,793 |
| Events in quadrant D | 68,588,053 | 17,706,380 |
| Mode M0 | |||
|---|---|---|---|
| Quadrant | BADHDUFLAG | Total packets | Discarded packets |
| A | 0 | 341626 | 0 |
| B | 0 | 349754 | 0 |
| C | 0 | 313956 | 0 |
| D | 0 | 435807 | 0 |
| Mode SS | |||
|---|---|---|---|
| Quadrant | BADHDUFLAG | Total packets | Discarded packets |
| A | 0 | 3026 | 0 |
| B | 0 | 3026 | 0 |
| C | 0 | 3026 | 0 |
| D | 0 | 3026 | 0 |
| Mode M9 | |||
|---|---|---|---|
| Quadrant | BADHDUFLAG | Total packets | Discarded packets |
| A | 0 | 246 | 0 |
| B | 0 | 246 | 0 |
| C | 0 | 246 | 0 |
| D | 0 | 246 | 0 |
| Quadrant | Total seconds | Saturated seconds | Saturation percentage |
|---|---|---|---|
| A | 149180 | 3627 | 2.431291% |
| B | 149180 | 5775 | 3.871162% |
| C | 149180 | 2303 | 1.543773% |
| D | 149180 | 10996 | 7.370961% |
Noise dominated data is calculated using 1-second bins in cleaned event files. If a bin has >2000 counts, and if more than 50% of those come from <1% of pixels, then it is considered to be noise-dominated and hence unusable.
| Quadrant | # 1 sec bins | Bins with >0 counts | Bins with >2000 counts | High rate bins dominated by noise | Noise dominated (total time) | Noise dominated (detector-on time) | Marked lightcurve |
|---|---|---|---|---|---|---|---|
| A | 172790 | 149159 | 60 | 60 | 0.03% | 0.04% |  |
| B | 172790 | 149156 | 2707 | 2707 | 1.57% | 1.81% |  |
| C | 172790 | 149160 | 4 | 4 | 0.00% | 0.00% |  |
| D | 172790 | 149157 | 2117 | 2117 | 1.23% | 1.42% |  |
Top three noisy pixels from each quadrant. If the there are fewer than three noisy pixels in the level2.evt file, extra rows are filled as -1
| Pixel properties | Quadrant properties | ||||||
|---|---|---|---|---|---|---|---|
| Quadrant | DetID | PixID | Counts | Sigma | Mean | Median | Sigma |
| A | 15 | 236 | 6425330 | 3699.66 | 7999 | 7869 | 1734.6 |
| A | 4 | 2 | 885924 | 506.2 | 7999 | 7869 | 1734.6 |
| A | 5 | 16 | 253668 | 141.7 | 7999 | 7869 | 1734.6 |
| B | 0 | 85 | 9060836 | 6059.9 | 8005 | 7822 | 1493.9 |
| B | 3 | 64 | 2745450 | 1832.51 | 8005 | 7822 | 1493.9 |
| B | 0 | 197 | 471924 | 310.66 | 8005 | 7822 | 1493.9 |
| C | 10 | 22 | 1069308 | 574.58 | 7861 | 7838 | 1847.4 |
| C | 5 | 4 | 68355 | 32.76 | 7861 | 7838 | 1847.4 |
| C | 13 | 61 | 45244 | 20.25 | 7861 | 7838 | 1847.4 |
| D | 12 | 235 | 16335523 | 9148.99 | 7773 | 7541 | 1784.7 |
| D | 1 | 52 | 10155268 | 5686.04 | 7773 | 7541 | 1784.7 |
| D | 7 | 238 | 8524943 | 4772.52 | 7773 | 7541 | 1784.7 |
Histogram calculated using DETX and DETY for each event in the final _common_clean file
| Quadrant A |  |
 |
Quadrant B |
|---|---|---|---|
| Quadrant D |  |
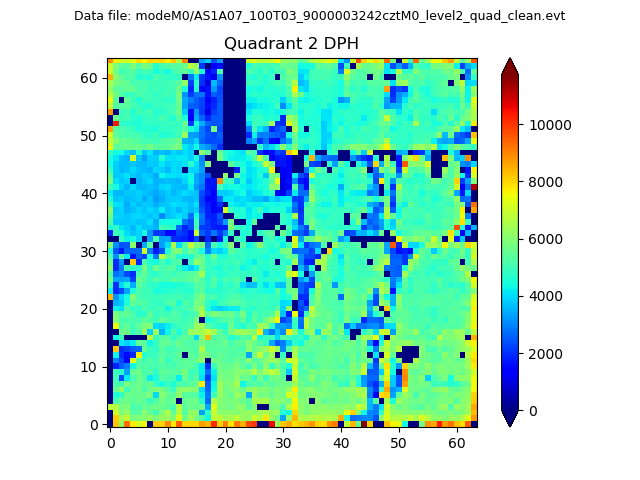 |
Quadrant C |
| Plot type | Count rate plots | Images |
|---|---|---|
| Comparison with Poisson distribution Blue bars denote a histogram of data divided into 1 sec bins. Red curve is a Poisson curve with rate = median count rate of data. |
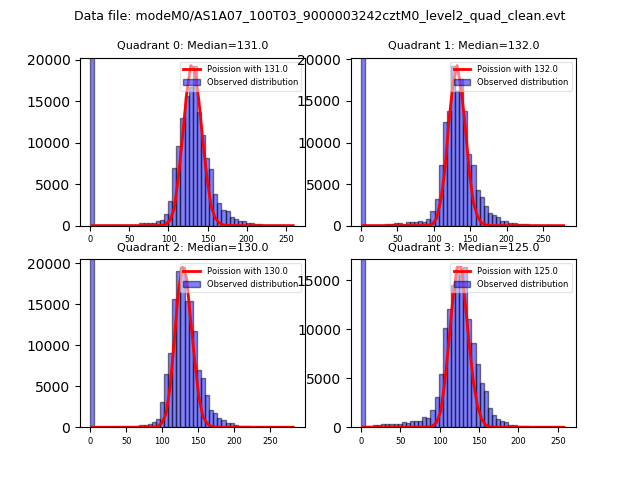 |
 |
| Quadrant-wise count rates Data is divided into 100 sec bins |
 |
|
| Module-wise count rates for Quadrant A Data is divided into 100 sec bins |
 |
 |
| Module-wise count rates for Quadrant B Data is divided into 100 sec bins |
 |
 |
| Module-wise count rates for Quadrant C Data is divided into 100 sec bins |
 |
 |
| Module-wise count rates for Quadrant D Data is divided into 100 sec bins |
 |
 |
| Parameter | Plot |
|---|---|
| CZT HV Monitor |  |
| D_VDD |  |
| Temperature 1 |  |
| Veto HV Monitor |  |
| Veto LLD |  |
| Alpha Counter |  |
| _CPM_Rate |  |
| CZT Counter |  |
| +2.5 Volts monitor |  |
| +5 Volts monitor |  |
| _ROLL_ROT |  |
| _Roll_DEC |  |
| _Roll_RA |  |
| Veto Counter |  |