| Param | Original file | Final file |
|---|---|---|
| Filename | modeM0/AS1A07_010T11_9000003240cztM0_level2_bc.evt | modeM0/AS1A07_010T11_9000003240cztM0_level2_quad_clean.evt |
| Size (bytes) | 1,641,908,160 | 505,474,560 |
| Size | 1.5 GB | 482.1 MB |
| Events in quadrant A | 7,480,866 | 3,276,410 |
| Events in quadrant B | 8,839,301 | 3,321,294 |
| Events in quadrant C | 7,316,127 | 3,176,978 |
| Events in quadrant D | 23,561,285 | 2,990,615 |
| Mode M0 | |||
|---|---|---|---|
| Quadrant | BADHDUFLAG | Total packets | Discarded packets |
| A | 0 | 75650 | 0 |
| B | 0 | 80373 | 0 |
| C | 0 | 76457 | 0 |
| D | 0 | 125384 | 0 |
| Mode SS | |||
|---|---|---|---|
| Quadrant | BADHDUFLAG | Total packets | Discarded packets |
| A | 0 | 752 | 0 |
| B | 0 | 752 | 0 |
| C | 0 | 752 | 0 |
| D | 0 | 752 | 0 |
| Mode M9 | |||
|---|---|---|---|
| Quadrant | BADHDUFLAG | Total packets | Discarded packets |
| A | 0 | 29 | 0 |
| B | 0 | 29 | 0 |
| C | 0 | 29 | 0 |
| D | 0 | 29 | 0 |
| Quadrant | Total seconds | Saturated seconds | Saturation percentage |
|---|---|---|---|
| A | 37050 | 226 | 0.609987% |
| B | 37049 | 719 | 1.940673% |
| C | 37047 | 557 | 1.503496% |
| D | 37042 | 6209 | 16.762054% |
Noise dominated data is calculated using 1-second bins in cleaned event files. If a bin has >2000 counts, and if more than 50% of those come from <1% of pixels, then it is considered to be noise-dominated and hence unusable.
| Quadrant | # 1 sec bins | Bins with >0 counts | Bins with >2000 counts | High rate bins dominated by noise | Noise dominated (total time) | Noise dominated (detector-on time) | Marked lightcurve |
|---|---|---|---|---|---|---|---|
| A | 39933 | 37068 | 2 | 2 | 0.01% | 0.01% |  |
| B | 39933 | 37065 | 137 | 137 | 0.34% | 0.37% | 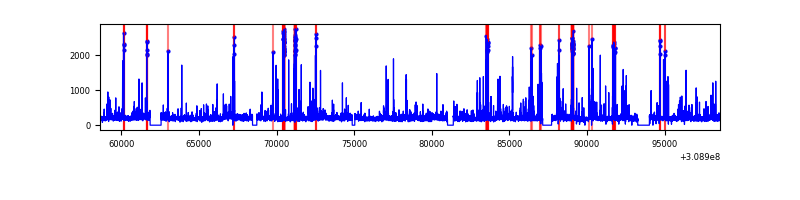 |
| C | 39933 | 37065 | 10 | 10 | 0.03% | 0.03% | 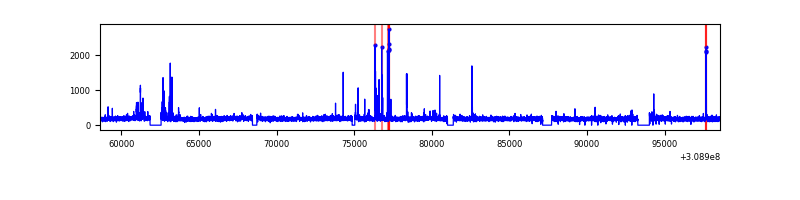 |
| D | 39933 | 37058 | 3734 | 3734 | 9.35% | 10.08% |  |
Top three noisy pixels from each quadrant. If the there are fewer than three noisy pixels in the level2.evt file, extra rows are filled as -1
| Pixel properties | Quadrant properties | ||||||
|---|---|---|---|---|---|---|---|
| Quadrant | DetID | PixID | Counts | Sigma | Mean | Median | Sigma |
| A | 5 | 16 | 225430 | 547.11 | 1861 | 1825 | 408.7 |
| A | 13 | 254 | 64728 | 153.91 | 1861 | 1825 | 408.7 |
| A | 4 | 2 | 34642 | 80.29 | 1861 | 1825 | 408.7 |
| B | 3 | 64 | 1199059 | 3362.22 | 1878 | 1830 | 356.1 |
| B | 0 | 197 | 142377 | 394.7 | 1878 | 1830 | 356.1 |
| B | 0 | 190 | 89774 | 246.98 | 1878 | 1830 | 356.1 |
| C | 10 | 22 | 334831 | 765.84 | 1807 | 1792 | 434.9 |
| C | 8 | 128 | 20369 | 42.72 | 1807 | 1792 | 434.9 |
| C | 10 | 91 | 11038 | 21.26 | 1807 | 1792 | 434.9 |
| D | 7 | 238 | 11785474 | 28654.13 | 1732 | 1669 | 411.2 |
| D | 1 | 52 | 4160893 | 10113.79 | 1732 | 1669 | 411.2 |
| D | 13 | 174 | 251129 | 606.6 | 1732 | 1669 | 411.2 |
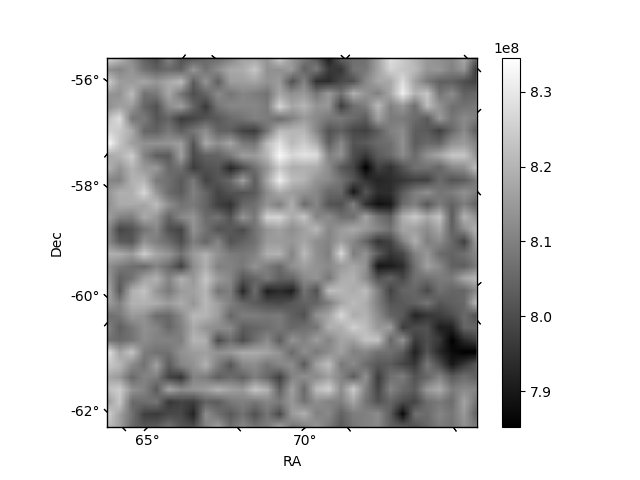
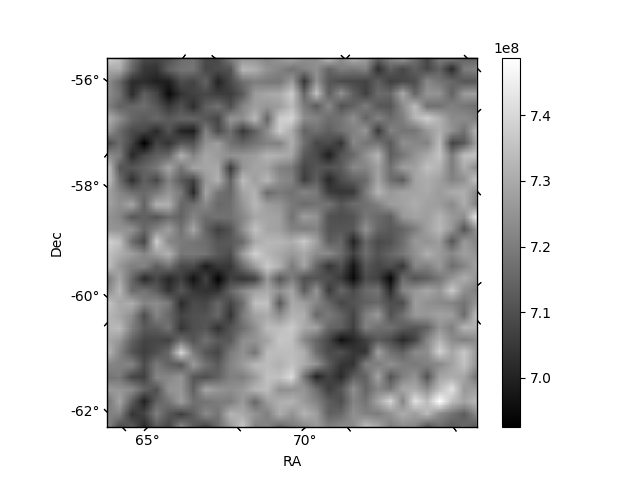
Histogram calculated using DETX and DETY for each event in the final _common_clean file
| Quadrant A |  |
 |
Quadrant B |
|---|---|---|---|
| Quadrant D |  |
 |
Quadrant C |
| Plot type | Count rate plots | Images |
|---|---|---|
| Comparison with Poisson distribution Blue bars denote a histogram of data divided into 1 sec bins. Red curve is a Poisson curve with rate = median count rate of data. |
 |
 |
| Quadrant-wise count rates Data is divided into 100 sec bins |
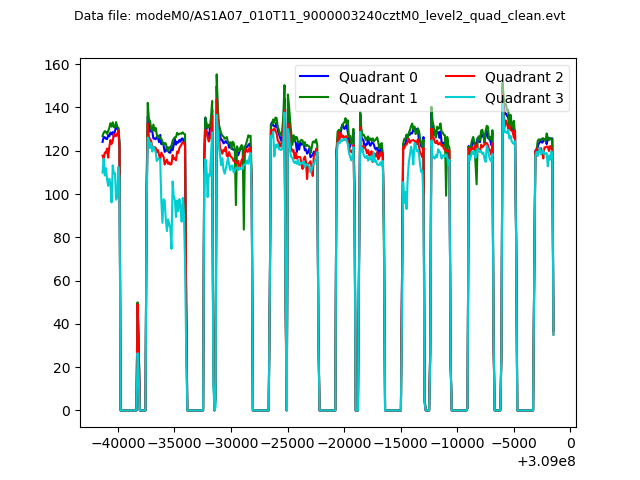 |
|
| Module-wise count rates for Quadrant A Data is divided into 100 sec bins |
 |
 |
| Module-wise count rates for Quadrant B Data is divided into 100 sec bins |
 |
 |
| Module-wise count rates for Quadrant C Data is divided into 100 sec bins |
 |
 |
| Module-wise count rates for Quadrant D Data is divided into 100 sec bins |
 |
 |
| Parameter | Plot |
|---|---|
| CZT HV Monitor |  |
| D_VDD | 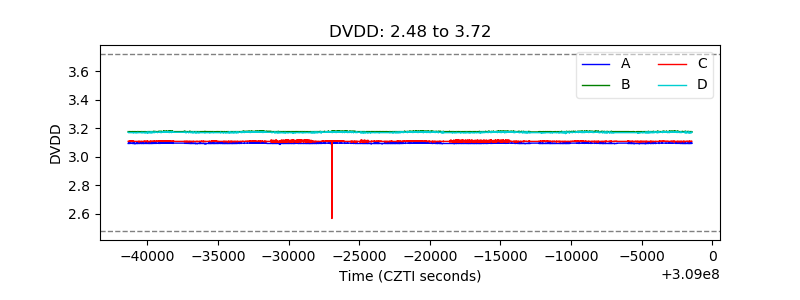 |
| Temperature 1 | 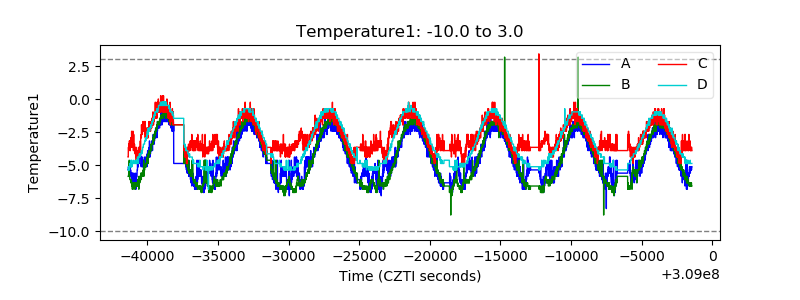 |
| Veto HV Monitor |  |
| Veto LLD |  |
| Alpha Counter |  |
| _CPM_Rate |  |
| CZT Counter |  |
| +2.5 Volts monitor |  |
| +5 Volts monitor |  |
| _ROLL_ROT |  |
| _Roll_DEC |  |
| _Roll_RA | 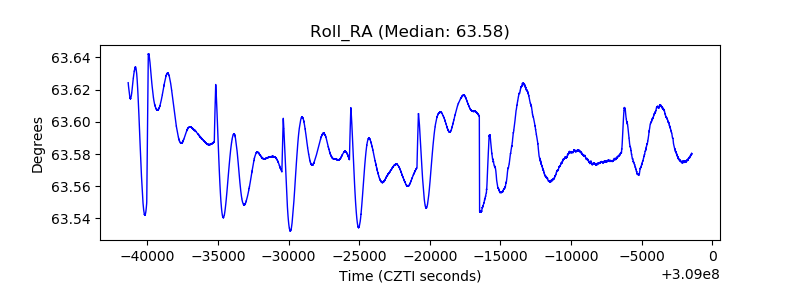 |
| Veto Counter | 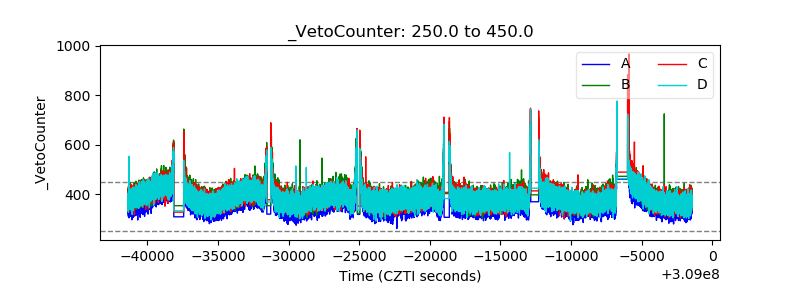 |