| Param | Original file | Final file |
|---|---|---|
| Filename | modeM0/AS1A07_010T06_9000003238cztM0_level2_bc.evt | modeM0/AS1A07_010T06_9000003238cztM0_level2_quad_clean.evt |
| Size (bytes) | 1,028,874,240 | 335,767,680 |
| Size | 981.2 MB | 320.2 MB |
| Events in quadrant A | 4,533,931 | 2,344,664 |
| Events in quadrant B | 4,644,422 | 2,397,605 |
| Events in quadrant C | 5,061,855 | 2,168,522 |
| Events in quadrant D | 15,651,959 | 1,981,053 |
| Mode SS | |||
|---|---|---|---|
| Quadrant | BADHDUFLAG | Total packets | Discarded packets |
| A | 0 | 380 | 0 |
| B | 0 | 380 | 0 |
| C | 0 | 380 | 0 |
| D | 0 | 380 | 0 |
| Mode M0 | |||
|---|---|---|---|
| Quadrant | BADHDUFLAG | Total packets | Discarded packets |
| A | 0 | 40310 | 0 |
| B | 0 | 40652 | 0 |
| C | 0 | 44947 | 0 |
| D | 0 | 77369 | 0 |
| Mode M9 | |||
|---|---|---|---|
| Quadrant | BADHDUFLAG | Total packets | Discarded packets |
| A | 0 | 51 | 0 |
| B | 0 | 51 | 0 |
| C | 0 | 51 | 0 |
| D | 0 | 51 | 0 |
| Quadrant | Total seconds | Saturated seconds | Saturation percentage |
|---|---|---|---|
| A | 18537 | 290 | 1.564439% |
| B | 18537 | 280 | 1.510493% |
| C | 18537 | 1035 | 5.583428% |
| D | 18537 | 4356 | 23.498948% |
Noise dominated data is calculated using 1-second bins in cleaned event files. If a bin has >2000 counts, and if more than 50% of those come from <1% of pixels, then it is considered to be noise-dominated and hence unusable.
| Quadrant | # 1 sec bins | Bins with >0 counts | Bins with >2000 counts | High rate bins dominated by noise | Noise dominated (total time) | Noise dominated (detector-on time) | Marked lightcurve |
|---|---|---|---|---|---|---|---|
| A | 23632 | 18534 | 9 | 9 | 0.04% | 0.05% |  |
| B | 23632 | 18535 | 4 | 4 | 0.02% | 0.02% |  |
| C | 23632 | 18535 | 37 | 37 | 0.16% | 0.20% |  |
| D | 23632 | 18534 | 1631 | 1631 | 6.90% | 8.80% | 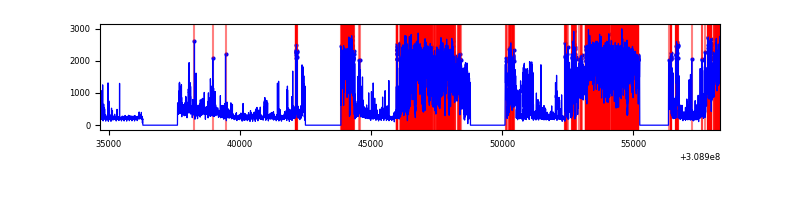 |
Top three noisy pixels from each quadrant. If the there are fewer than three noisy pixels in the level2.evt file, extra rows are filled as -1
| Pixel properties | Quadrant properties | ||||||
|---|---|---|---|---|---|---|---|
| Quadrant | DetID | PixID | Counts | Sigma | Mean | Median | Sigma |
| A | 5 | 16 | 228334 | 968.04 | 1094 | 1082 | 234.8 |
| A | 4 | 2 | 81403 | 342.15 | 1094 | 1082 | 234.8 |
| A | 13 | 254 | 31975 | 131.6 | 1094 | 1082 | 234.8 |
| B | 3 | 64 | 142975 | 678.8 | 1115 | 1094 | 209.0 |
| B | 4 | 173 | 41441 | 193.03 | 1115 | 1094 | 209.0 |
| B | 0 | 190 | 40051 | 186.38 | 1115 | 1094 | 209.0 |
| C | 10 | 22 | 1143202 | 4805.08 | 1014 | 1016 | 237.7 |
| C | 0 | 10 | 13630 | 53.07 | 1014 | 1016 | 237.7 |
| C | 4 | 175 | 7720 | 28.2 | 1014 | 1016 | 237.7 |
| D | 7 | 238 | 11366347 | 51296.15 | 951 | 924 | 221.6 |
| D | 12 | 227 | 240600 | 1081.74 | 951 | 924 | 221.6 |
| D | 1 | 52 | 100148 | 447.83 | 951 | 924 | 221.6 |
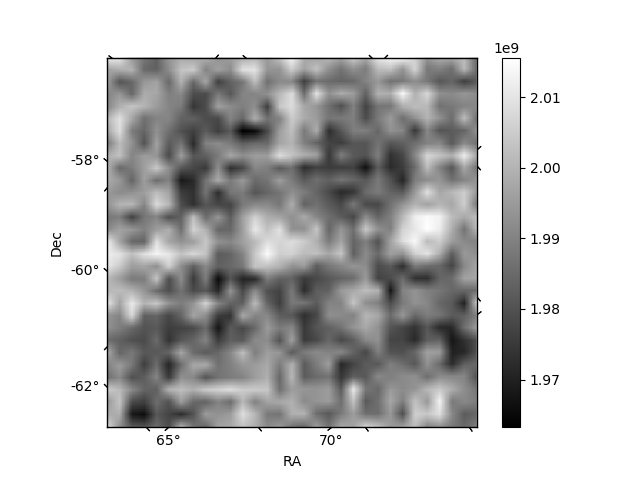
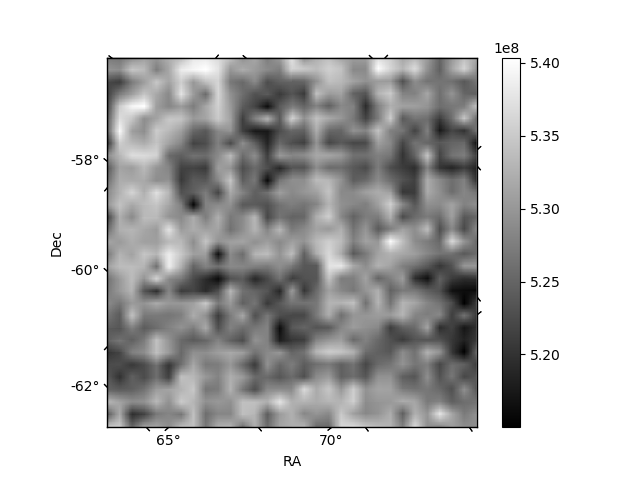
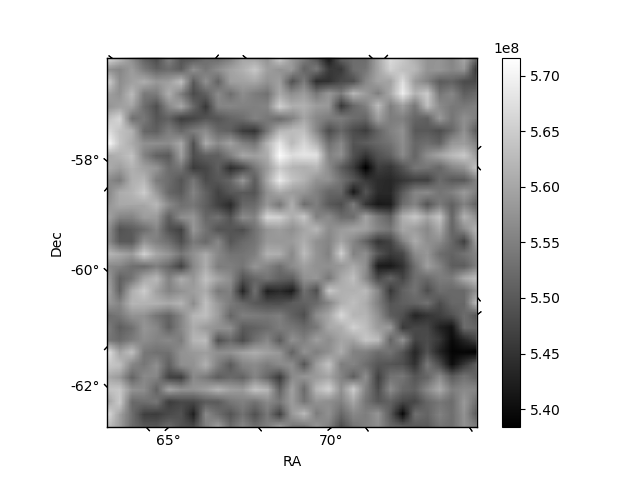
Histogram calculated using DETX and DETY for each event in the final _common_clean file
| Quadrant A |  |
 |
Quadrant B |
|---|---|---|---|
| Quadrant D |  |
 |
Quadrant C |
| Plot type | Count rate plots | Images |
|---|---|---|
| Comparison with Poisson distribution Blue bars denote a histogram of data divided into 1 sec bins. Red curve is a Poisson curve with rate = median count rate of data. |
 |
 |
| Quadrant-wise count rates Data is divided into 100 sec bins |
 |
|
| Module-wise count rates for Quadrant A Data is divided into 100 sec bins |
 |
 |
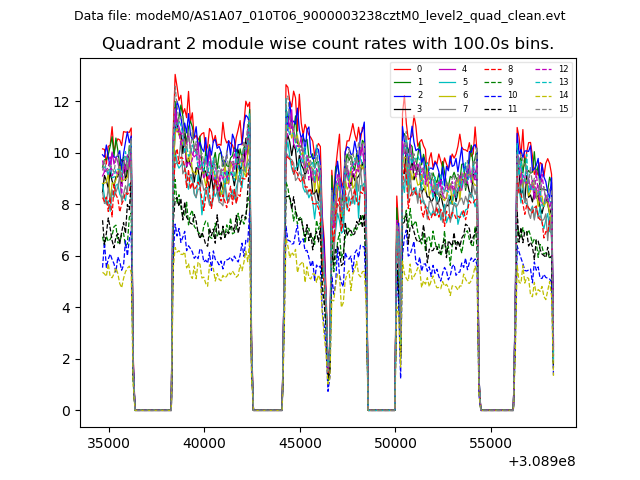
| Module-wise count rates for Quadrant B Data is divided into 100 sec bins |
 |
 |
| Module-wise count rates for Quadrant C Data is divided into 100 sec bins |
 |
 |
| Module-wise count rates for Quadrant D Data is divided into 100 sec bins |
 |
 |
| Parameter | Plot |
|---|---|
| CZT HV Monitor | 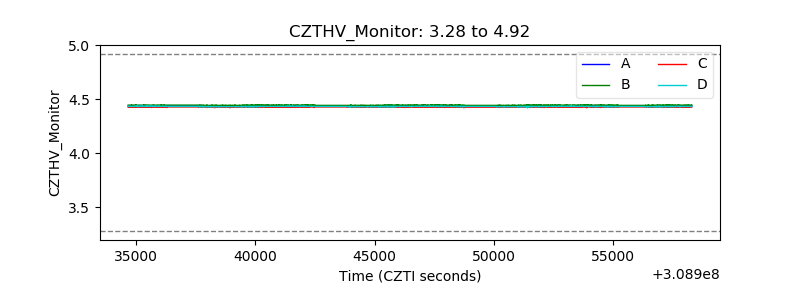 |
| D_VDD |  |
| Temperature 1 |  |
| Veto HV Monitor |  |
| Veto LLD | 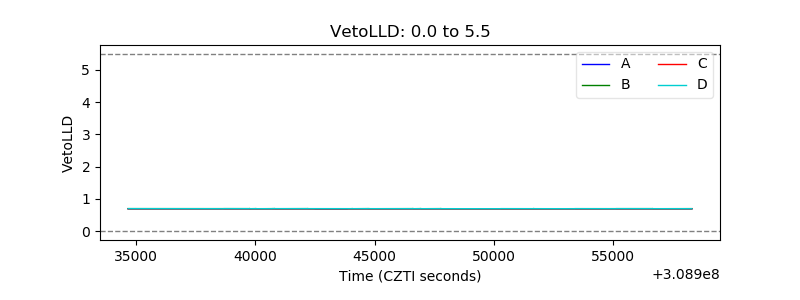 |
| Alpha Counter | 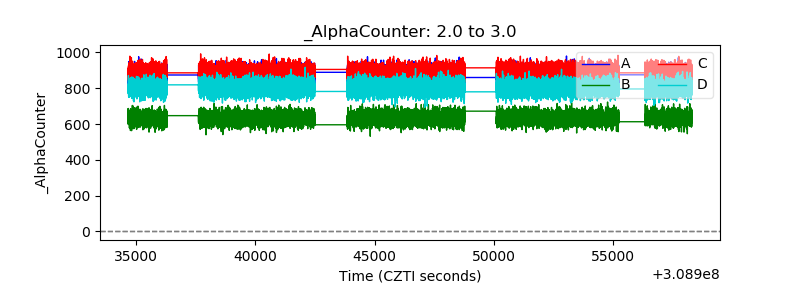 |
| _CPM_Rate | 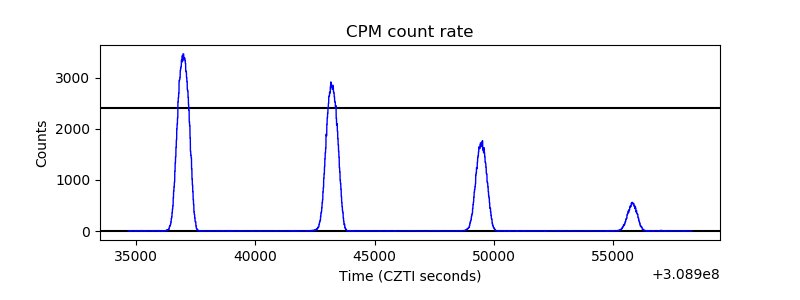 |
| CZT Counter |  |
| +2.5 Volts monitor | 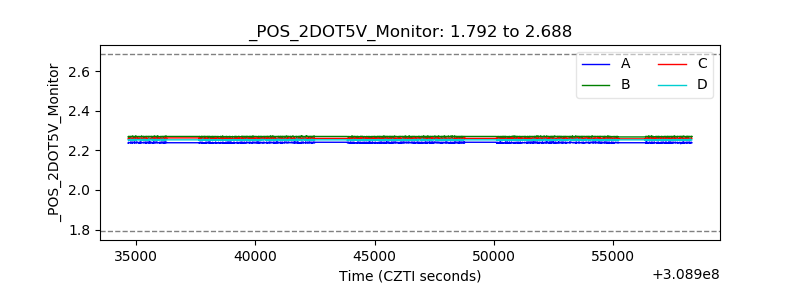 |
| +5 Volts monitor |  |
| _ROLL_ROT |  |
| _Roll_DEC | 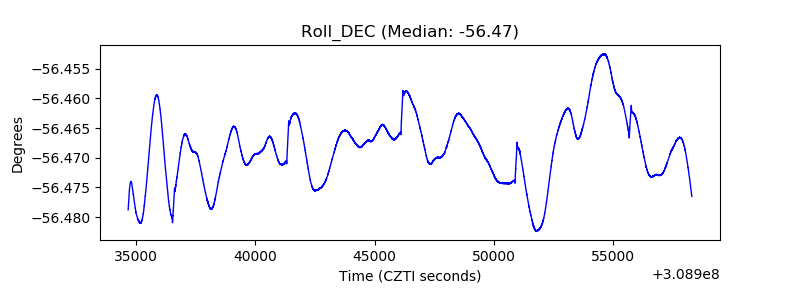 |
| _Roll_RA |  |
| Veto Counter | 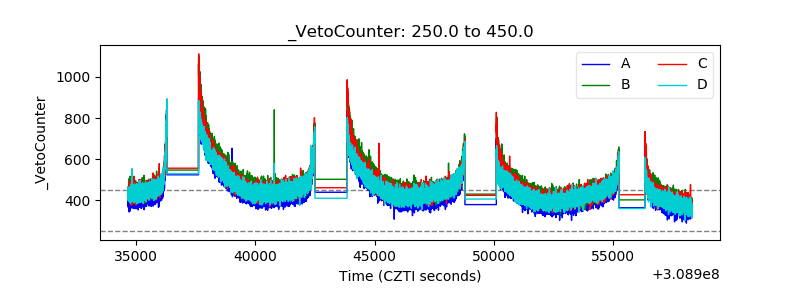 |