| Param | Original file | Final file |
|---|---|---|
| Filename | modeM0/AS1A07_010T05_9000003236cztM0_level2_bc.evt | modeM0/AS1A07_010T05_9000003236cztM0_level2_quad_clean.evt |
| Size (bytes) | 659,563,200 | 282,476,160 |
| Size | 629.0 MB | 269.4 MB |
| Events in quadrant A | 4,347,897 | 1,846,597 |
| Events in quadrant B | 4,704,201 | 1,864,107 |
| Events in quadrant C | 4,801,899 | 1,756,157 |
| Events in quadrant D | 4,790,880 | 1,751,586 |
| Mode M0 | |||
|---|---|---|---|
| Quadrant | BADHDUFLAG | Total packets | Discarded packets |
| A | 0 | 41310 | 0 |
| B | 0 | 42414 | 0 |
| C | 0 | 45332 | 0 |
| D | 0 | 42256 | 0 |
| Mode SS | |||
|---|---|---|---|
| Quadrant | BADHDUFLAG | Total packets | Discarded packets |
| A | 0 | 396 | 0 |
| B | 0 | 396 | 0 |
| C | 0 | 396 | 0 |
| D | 0 | 396 | 0 |
| Mode M9 | |||
|---|---|---|---|
| Quadrant | BADHDUFLAG | Total packets | Discarded packets |
| A | 0 | 42 | 0 |
| B | 0 | 42 | 0 |
| C | 0 | 42 | 0 |
| D | 0 | 42 | 0 |
| Quadrant | Total seconds | Saturated seconds | Saturation percentage |
|---|---|---|---|
| A | 19418 | 235 | 1.210217% |
| B | 19418 | 305 | 1.570708% |
| C | 19418 | 900 | 4.634875% |
| D | 19418 | 224 | 1.153569% |
Noise dominated data is calculated using 1-second bins in cleaned event files. If a bin has >2000 counts, and if more than 50% of those come from <1% of pixels, then it is considered to be noise-dominated and hence unusable.
| Quadrant | # 1 sec bins | Bins with >0 counts | Bins with >2000 counts | High rate bins dominated by noise | Noise dominated (total time) | Noise dominated (detector-on time) | Marked lightcurve |
|---|---|---|---|---|---|---|---|
| A | 23633 | 19416 | 1 | 1 | 0.00% | 0.01% | 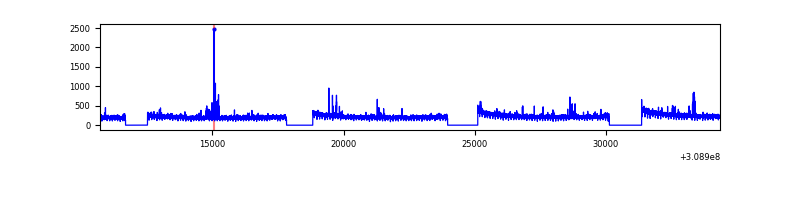 |
| B | 23633 | 19413 | 6 | 6 | 0.03% | 0.03% |  |
| C | 23633 | 19413 | 25 | 25 | 0.11% | 0.13% |  |
| D | 23633 | 19414 | 4 | 4 | 0.02% | 0.02% |  |
Top three noisy pixels from each quadrant. If the there are fewer than three noisy pixels in the level2.evt file, extra rows are filled as -1
| Pixel properties | Quadrant properties | ||||||
|---|---|---|---|---|---|---|---|
| Quadrant | DetID | PixID | Counts | Sigma | Mean | Median | Sigma |
| A | 5 | 16 | 82995 | 346.24 | 1104 | 1087 | 236.6 |
| A | 13 | 254 | 33692 | 137.83 | 1104 | 1087 | 236.6 |
| A | 0 | 226 | 7164 | 25.69 | 1104 | 1087 | 236.6 |
| B | 3 | 64 | 152424 | 733.12 | 1113 | 1091 | 206.4 |
| B | 0 | 197 | 69048 | 329.21 | 1113 | 1091 | 206.4 |
| B | 0 | 230 | 65524 | 312.14 | 1113 | 1091 | 206.4 |
| C | 10 | 22 | 829590 | 3401.08 | 1031 | 1028 | 243.6 |
| C | 4 | 175 | 12836 | 48.47 | 1031 | 1028 | 243.6 |
| C | 13 | 61 | 6258 | 21.47 | 1031 | 1028 | 243.6 |
| D | 7 | 238 | 209483 | 803.63 | 1075 | 1044 | 259.4 |
| D | 1 | 52 | 141101 | 539.99 | 1075 | 1044 | 259.4 |
| D | 2 | 234 | 89534 | 341.17 | 1075 | 1044 | 259.4 |
Histogram calculated using DETX and DETY for each event in the final _common_clean file
| Quadrant A |  |
 |
Quadrant B |
|---|---|---|---|
| Quadrant D |  |
 |
Quadrant C |
| Plot type | Count rate plots | Images |
|---|---|---|
| Comparison with Poisson distribution Blue bars denote a histogram of data divided into 1 sec bins. Red curve is a Poisson curve with rate = median count rate of data. |
 |
 |
| Quadrant-wise count rates Data is divided into 100 sec bins |
 |
|
| Module-wise count rates for Quadrant A Data is divided into 100 sec bins |
 |
 |
| Module-wise count rates for Quadrant B Data is divided into 100 sec bins |
 |
 |
| Module-wise count rates for Quadrant C Data is divided into 100 sec bins |
 |
 |
| Module-wise count rates for Quadrant D Data is divided into 100 sec bins |
 |
 |
| Parameter | Plot |
|---|---|
| CZT HV Monitor |  |
| D_VDD |  |
| Temperature 1 |  |
| Veto HV Monitor |  |
| Veto LLD |  |
| Alpha Counter |  |
| _CPM_Rate |  |
| CZT Counter |  |
| +2.5 Volts monitor |  |
| +5 Volts monitor |  |
| _ROLL_ROT |  |
| _Roll_DEC |  |
| _Roll_RA |  |
| Veto Counter | 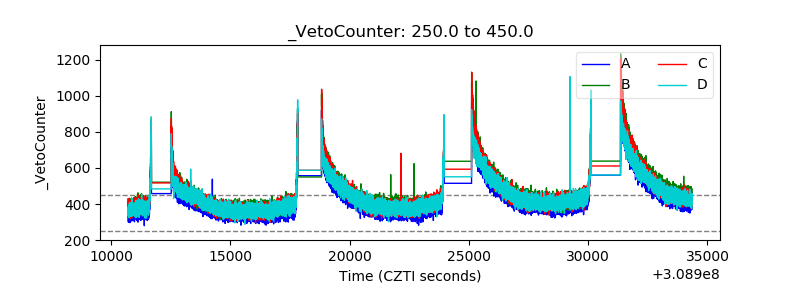 |