| Param | Original file | Final file |
|---|---|---|
| Filename | modeM0/AS1A07_041T01_9000003234cztM0_level2_bc.evt | modeM0/AS1A07_041T01_9000003234cztM0_level2_quad_clean.evt |
| Size (bytes) | 2,877,598,080 | 1,177,974,720 |
| Size | 2.7 GB | 1.1 GB |
| Events in quadrant A | 18,037,137 | 7,585,413 |
| Events in quadrant B | 19,499,412 | 7,695,381 |
| Events in quadrant C | 17,334,123 | 7,442,617 |
| Events in quadrant D | 26,501,748 | 7,148,676 |
| Mode SS | |||
|---|---|---|---|
| Quadrant | BADHDUFLAG | Total packets | Discarded packets |
| A | 0 | 1726 | 0 |
| B | 0 | 1726 | 0 |
| C | 0 | 1726 | 0 |
| D | 0 | 1726 | 0 |
| Mode M9 | |||
|---|---|---|---|
| Quadrant | BADHDUFLAG | Total packets | Discarded packets |
| A | 0 | 128 | 0 |
| B | 0 | 128 | 0 |
| C | 0 | 128 | 0 |
| D | 0 | 128 | 0 |
| Mode M0 | |||
|---|---|---|---|
| Quadrant | BADHDUFLAG | Total packets | Discarded packets |
| A | 0 | 177173 | 0 |
| B | 0 | 181468 | 0 |
| C | 0 | 177075 | 0 |
| D | 0 | 207705 | 0 |
| Quadrant | Total seconds | Saturated seconds | Saturation percentage |
|---|---|---|---|
| A | 84741 | 821 | 0.968834% |
| B | 84741 | 995 | 1.174166% |
| C | 84741 | 1382 | 1.630852% |
| D | 84742 | 2536 | 2.992613% |
Noise dominated data is calculated using 1-second bins in cleaned event files. If a bin has >2000 counts, and if more than 50% of those come from <1% of pixels, then it is considered to be noise-dominated and hence unusable.
| Quadrant | # 1 sec bins | Bins with >0 counts | Bins with >2000 counts | High rate bins dominated by noise | Noise dominated (total time) | Noise dominated (detector-on time) | Marked lightcurve |
|---|---|---|---|---|---|---|---|
| A | 97626 | 84733 | 24 | 24 | 0.02% | 0.03% |  |
| B | 97626 | 84733 | 35 | 35 | 0.04% | 0.04% |  |
| C | 97626 | 84736 | 61 | 61 | 0.06% | 0.07% | 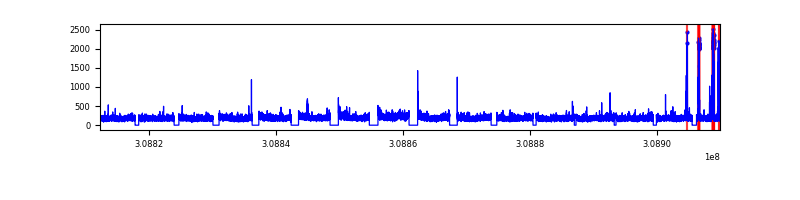 |
| D | 97627 | 84734 | 280 | 280 | 0.29% | 0.33% |  |
Top three noisy pixels from each quadrant. If the there are fewer than three noisy pixels in the level2.evt file, extra rows are filled as -1
| Pixel properties | Quadrant properties | ||||||
|---|---|---|---|---|---|---|---|
| Quadrant | DetID | PixID | Counts | Sigma | Mean | Median | Sigma |
| A | 5 | 16 | 541178 | 553.12 | 4432 | 4351 | 970.5 |
| A | 4 | 2 | 243344 | 246.25 | 4432 | 4351 | 970.5 |
| A | 13 | 254 | 150819 | 150.91 | 4432 | 4351 | 970.5 |
| B | 3 | 64 | 574918 | 674.9 | 4492 | 4387 | 845.4 |
| B | 0 | 197 | 417801 | 489.04 | 4492 | 4387 | 845.4 |
| B | 0 | 190 | 375176 | 438.62 | 4492 | 4387 | 845.4 |
| C | 10 | 22 | 697323 | 689.62 | 4270 | 4251 | 1005.0 |
| C | 10 | 91 | 143328 | 138.38 | 4270 | 4251 | 1005.0 |
| C | 8 | 208 | 36274 | 31.86 | 4270 | 4251 | 1005.0 |
| D | 1 | 52 | 5312364 | 5158.3 | 4300 | 4139 | 1029.1 |
| D | 7 | 238 | 2226590 | 2159.68 | 4300 | 4139 | 1029.1 |
| D | 2 | 136 | 922352 | 892.28 | 4300 | 4139 | 1029.1 |
Histogram calculated using DETX and DETY for each event in the final _common_clean file
| Quadrant A |  |
 |
Quadrant B |
|---|---|---|---|
| Quadrant D |  |
 |
Quadrant C |
| Plot type | Count rate plots | Images |
|---|---|---|
| Comparison with Poisson distribution Blue bars denote a histogram of data divided into 1 sec bins. Red curve is a Poisson curve with rate = median count rate of data. |
 |
 |
| Quadrant-wise count rates Data is divided into 100 sec bins |
 |
|
| Module-wise count rates for Quadrant A Data is divided into 100 sec bins |
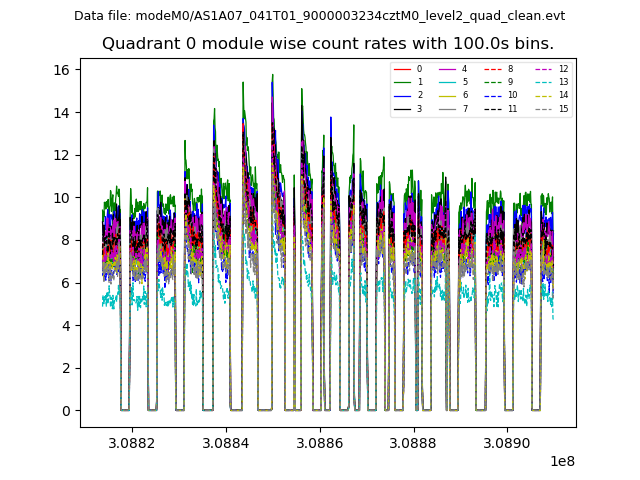 |
 |
| Module-wise count rates for Quadrant B Data is divided into 100 sec bins |
 |
 |
| Module-wise count rates for Quadrant C Data is divided into 100 sec bins |
 |
 |
| Module-wise count rates for Quadrant D Data is divided into 100 sec bins |
 |
 |
| Parameter | Plot |
|---|---|
| CZT HV Monitor | 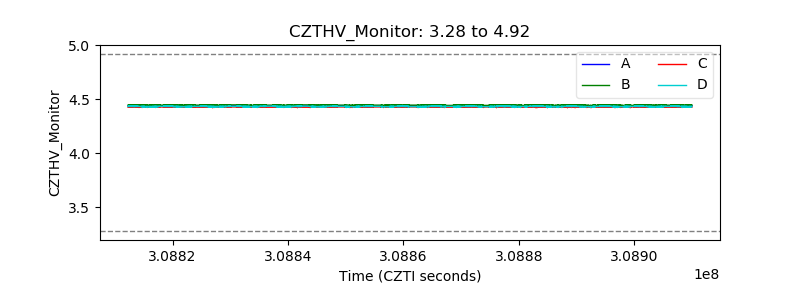 |
| D_VDD |  |
| Temperature 1 |  |
| Veto HV Monitor | 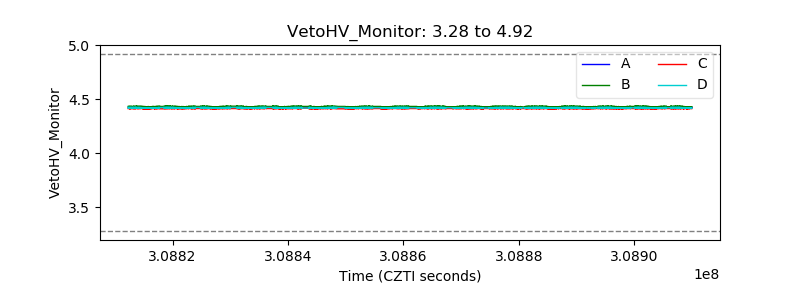 |
| Veto LLD |  |
| Alpha Counter |  |
| _CPM_Rate |  |
| CZT Counter |  |
| +2.5 Volts monitor |  |
| +5 Volts monitor |  |
| _ROLL_ROT |  |
| _Roll_DEC |  |
| _Roll_RA |  |
| Veto Counter |  |