| Param | Original file | Final file |
|---|---|---|
| Filename | modeM0/AS1A07_118T01_9000003232cztM0_level2_bc.evt | modeM0/AS1A07_118T01_9000003232cztM0_level2_quad_clean.evt |
| Size (bytes) | 3,850,683,840 | 1,336,924,800 |
| Size | 3.6 GB | 1.2 GB |
| Events in quadrant A | 23,168,096 | 8,569,744 |
| Events in quadrant B | 24,877,325 | 8,722,397 |
| Events in quadrant C | 21,265,765 | 8,455,075 |
| Events in quadrant D | 40,008,473 | 7,408,293 |
| Mode SS | |||
|---|---|---|---|
| Quadrant | BADHDUFLAG | Total packets | Discarded packets |
| A | 0 | 2174 | 0 |
| B | 0 | 2174 | 0 |
| C | 0 | 2174 | 0 |
| D | 0 | 2174 | 0 |
| Mode M9 | |||
|---|---|---|---|
| Quadrant | BADHDUFLAG | Total packets | Discarded packets |
| A | 0 | 158 | 0 |
| B | 0 | 158 | 0 |
| C | 0 | 158 | 0 |
| D | 0 | 158 | 0 |
| Mode M0 | |||
|---|---|---|---|
| Quadrant | BADHDUFLAG | Total packets | Discarded packets |
| A | 0 | 225954 | 0 |
| B | 0 | 231754 | 0 |
| C | 0 | 222370 | 0 |
| D | 0 | 318496 | 0 |
| Quadrant | Total seconds | Saturated seconds | Saturation percentage |
|---|---|---|---|
| A | 107044 | 1436 | 1.341504% |
| B | 107044 | 2037 | 1.902956% |
| C | 107044 | 1848 | 1.726393% |
| D | 107044 | 12415 | 11.598034% |
Noise dominated data is calculated using 1-second bins in cleaned event files. If a bin has >2000 counts, and if more than 50% of those come from <1% of pixels, then it is considered to be noise-dominated and hence unusable.
| Quadrant | # 1 sec bins | Bins with >0 counts | Bins with >2000 counts | High rate bins dominated by noise | Noise dominated (total time) | Noise dominated (detector-on time) | Marked lightcurve |
|---|---|---|---|---|---|---|---|
| A | 122805 | 107034 | 33 | 33 | 0.03% | 0.03% |  |
| B | 122805 | 107033 | 110 | 110 | 0.09% | 0.10% |  |
| C | 122805 | 107033 | 3 | 3 | 0.00% | 0.00% | 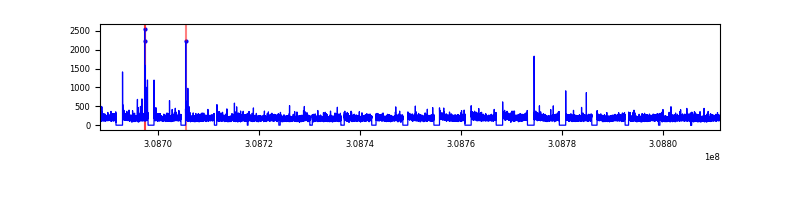 |
| D | 122805 | 106835 | 1511 | 1511 | 1.23% | 1.41% |  |
Top three noisy pixels from each quadrant. If the there are fewer than three noisy pixels in the level2.evt file, extra rows are filled as -1
| Pixel properties | Quadrant properties | ||||||
|---|---|---|---|---|---|---|---|
| Quadrant | DetID | PixID | Counts | Sigma | Mean | Median | Sigma |
| A | 4 | 2 | 561154 | 453.6 | 5654 | 5541 | 1224.9 |
| A | 5 | 16 | 470886 | 379.91 | 5654 | 5541 | 1224.9 |
| A | 6 | 16 | 206718 | 164.24 | 5654 | 5541 | 1224.9 |
| B | 3 | 64 | 1394421 | 1296.52 | 5741 | 5592 | 1071.2 |
| B | 0 | 230 | 388503 | 357.46 | 5741 | 5592 | 1071.2 |
| B | 0 | 190 | 340343 | 312.5 | 5741 | 5592 | 1071.2 |
| C | 0 | 10 | 64282 | 45.93 | 5489 | 5450 | 1281.0 |
| C | 5 | 112 | 49671 | 34.52 | 5489 | 5450 | 1281.0 |
| C | 13 | 61 | 32029 | 20.75 | 5489 | 5450 | 1281.0 |
| D | 1 | 52 | 14016820 | 10953.06 | 5102 | 4946 | 1279.3 |
| D | 7 | 238 | 2798285 | 2183.55 | 5102 | 4946 | 1279.3 |
| D | 2 | 136 | 880343 | 684.3 | 5102 | 4946 | 1279.3 |
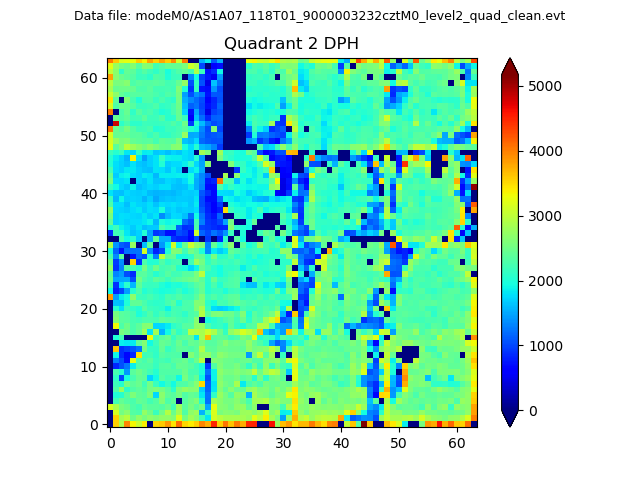
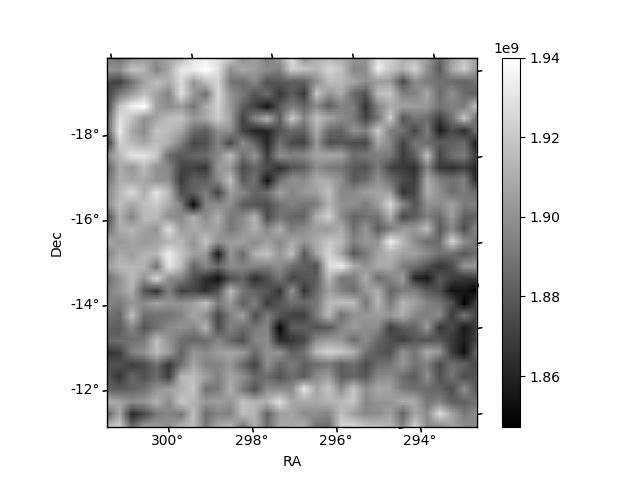
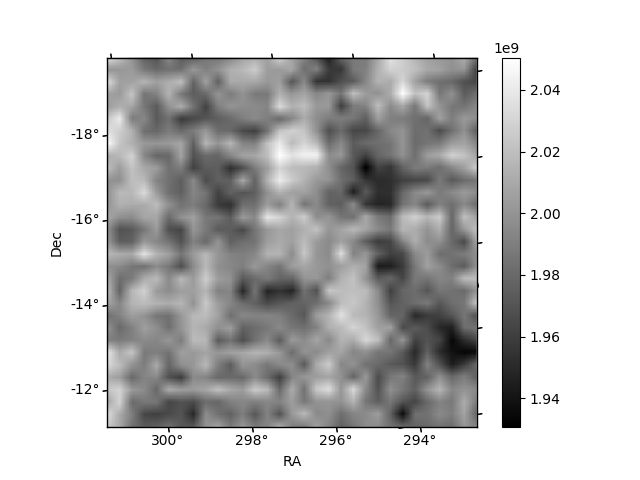
Histogram calculated using DETX and DETY for each event in the final _common_clean file
| Quadrant A | 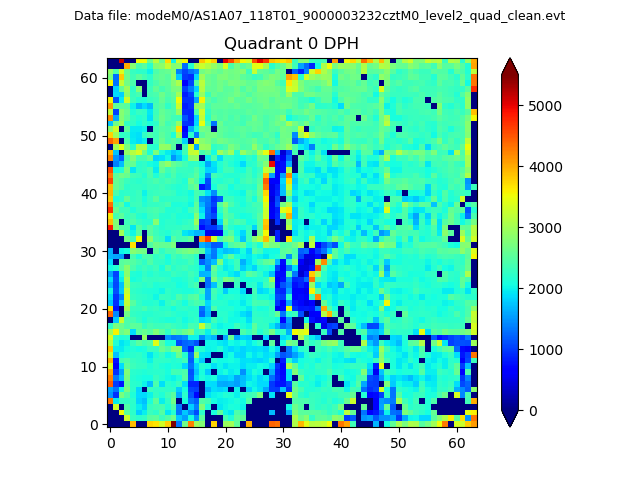 |
 |
Quadrant B |
|---|---|---|---|
| Quadrant D |  |
 |
Quadrant C |
| Plot type | Count rate plots | Images |
|---|---|---|
| Comparison with Poisson distribution Blue bars denote a histogram of data divided into 1 sec bins. Red curve is a Poisson curve with rate = median count rate of data. |
 |
 |
| Quadrant-wise count rates Data is divided into 100 sec bins |
 |
|
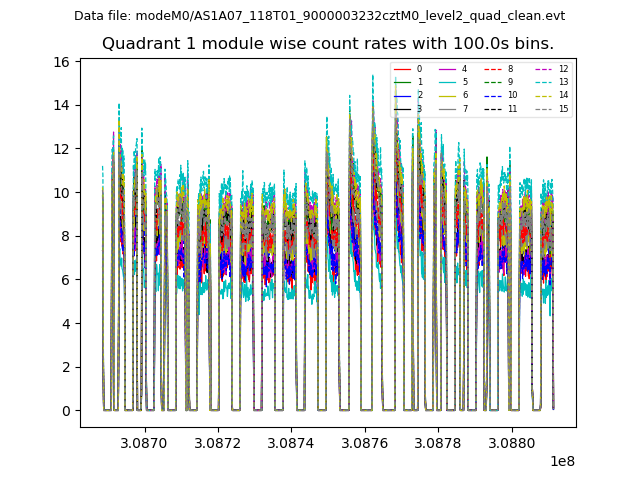
| Module-wise count rates for Quadrant A Data is divided into 100 sec bins |
 |
 |
| Module-wise count rates for Quadrant B Data is divided into 100 sec bins |
 |
 |
| Module-wise count rates for Quadrant C Data is divided into 100 sec bins |
 |
 |
| Module-wise count rates for Quadrant D Data is divided into 100 sec bins |
 |
 |
| Parameter | Plot |
|---|---|
| CZT HV Monitor |  |
| D_VDD | 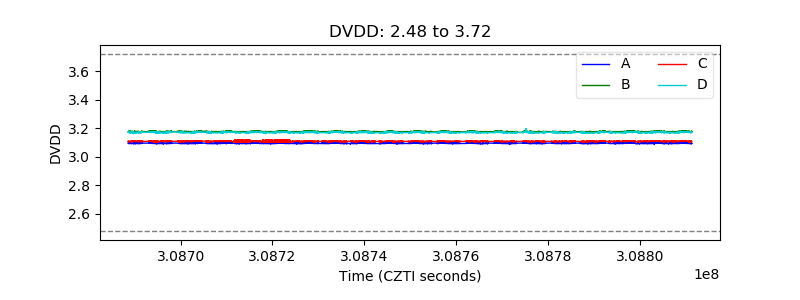 |
| Temperature 1 |  |
| Veto HV Monitor |  |
| Veto LLD |  |
| Alpha Counter |  |
| _CPM_Rate |  |
| CZT Counter | 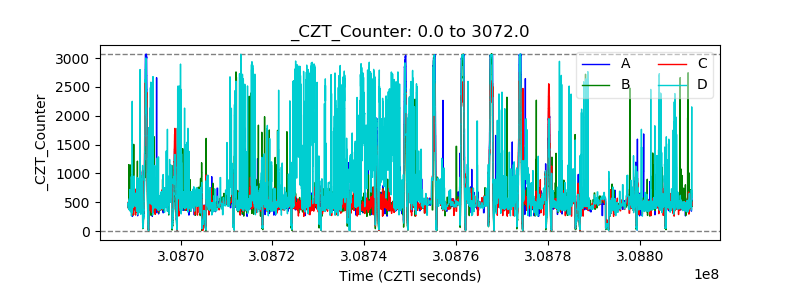 |
| +2.5 Volts monitor |  |
| +5 Volts monitor |  |
| _ROLL_ROT |  |
| _Roll_DEC | 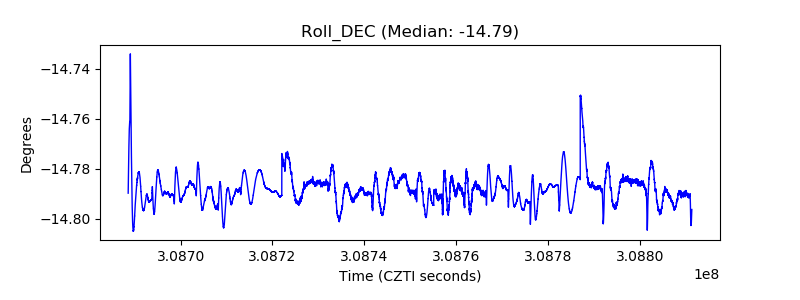 |
| _Roll_RA | 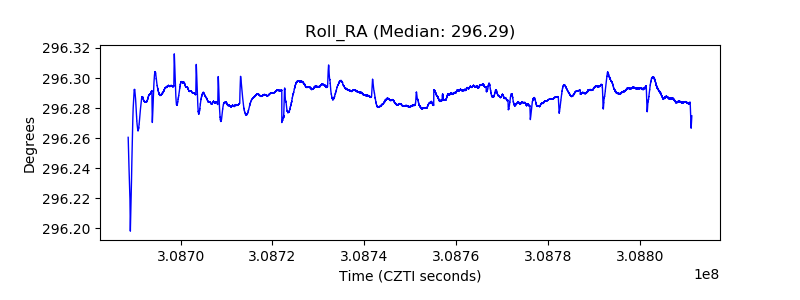 |
| Veto Counter |  |