| Param | Original file | Final file |
|---|---|---|
| Filename | modeM0/AS1A07_004T01_9000003230cztM0_level2_bc.evt | modeM0/AS1A07_004T01_9000003230cztM0_level2_quad_clean.evt |
| Size (bytes) | 8,519,204,160 | 3,124,103,040 |
| Size | 7.9 GB | 2.9 GB |
| Events in quadrant A | 53,856,949 | 19,732,160 |
| Events in quadrant B | 60,444,373 | 20,096,647 |
| Events in quadrant C | 48,916,207 | 19,427,910 |
| Events in quadrant D | 78,098,677 | 18,584,077 |
| Mode SS | |||
|---|---|---|---|
| Quadrant | BADHDUFLAG | Total packets | Discarded packets |
| A | 0 | 5002 | 0 |
| B | 0 | 5002 | 0 |
| C | 0 | 5002 | 0 |
| D | 0 | 5002 | 0 |
| Mode M0 | |||
|---|---|---|---|
| Quadrant | BADHDUFLAG | Total packets | Discarded packets |
| A | 0 | 517786 | 0 |
| B | 0 | 538380 | 0 |
| C | 0 | 507541 | 0 |
| D | 0 | 599119 | 0 |
| Mode M9 | |||
|---|---|---|---|
| Quadrant | BADHDUFLAG | Total packets | Discarded packets |
| A | 0 | 410 | 0 |
| B | 0 | 410 | 0 |
| C | 0 | 410 | 0 |
| D | 0 | 410 | 0 |
| Quadrant | Total seconds | Saturated seconds | Saturation percentage |
|---|---|---|---|
| A | 245116 | 3581 | 1.460941% |
| B | 245116 | 4741 | 1.934186% |
| C | 245116 | 3857 | 1.573541% |
| D | 245116 | 6585 | 2.686483% |
Noise dominated data is calculated using 1-second bins in cleaned event files. If a bin has >2000 counts, and if more than 50% of those come from <1% of pixels, then it is considered to be noise-dominated and hence unusable.
| Quadrant | # 1 sec bins | Bins with >0 counts | Bins with >2000 counts | High rate bins dominated by noise | Noise dominated (total time) | Noise dominated (detector-on time) | Marked lightcurve |
|---|---|---|---|---|---|---|---|
| A | 286357 | 245107 | 264 | 264 | 0.09% | 0.11% |  |
| B | 286357 | 245103 | 449 | 449 | 0.16% | 0.18% | 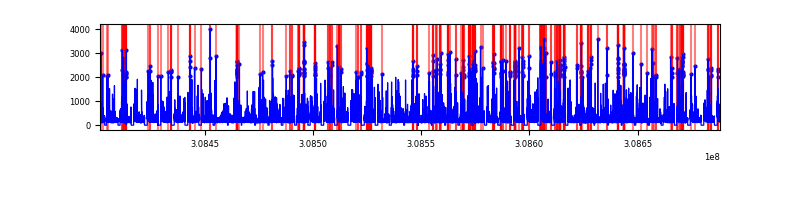 |
| C | 286357 | 245102 | 1 | 1 | 0.00% | 0.00% |  |
| D | 286357 | 245106 | 751 | 751 | 0.26% | 0.31% |  |
Top three noisy pixels from each quadrant. If the there are fewer than three noisy pixels in the level2.evt file, extra rows are filled as -1
| Pixel properties | Quadrant properties | ||||||
|---|---|---|---|---|---|---|---|
| Quadrant | DetID | PixID | Counts | Sigma | Mean | Median | Sigma |
| A | 4 | 2 | 1228968 | 429.56 | 13014 | 12769 | 2831.3 |
| A | 5 | 16 | 888613 | 309.35 | 13014 | 12769 | 2831.3 |
| A | 14 | 235 | 885753 | 308.34 | 13014 | 12769 | 2831.3 |
| B | 3 | 64 | 4737666 | 1897.52 | 13219 | 12886 | 2490.0 |
| B | 0 | 230 | 938551 | 371.76 | 13219 | 12886 | 2490.0 |
| B | 0 | 245 | 928950 | 367.9 | 13219 | 12886 | 2490.0 |
| C | 3 | 248 | 163407 | 51.28 | 12578 | 12514 | 2942.7 |
| C | 4 | 175 | 101432 | 30.22 | 12578 | 12514 | 2942.7 |
| C | 5 | 112 | 94479 | 27.85 | 12578 | 12514 | 2942.7 |
| D | 1 | 52 | 15174815 | 4746.74 | 12559 | 12182 | 3194.3 |
| D | 7 | 238 | 3387994 | 1056.81 | 12559 | 12182 | 3194.3 |
| D | 13 | 174 | 3305650 | 1031.04 | 12559 | 12182 | 3194.3 |
Histogram calculated using DETX and DETY for each event in the final _common_clean file
| Quadrant A |  |
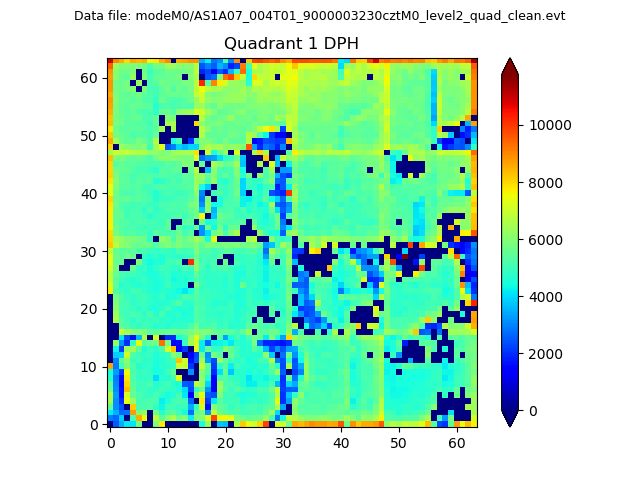 |
Quadrant B |
|---|---|---|---|
| Quadrant D |  |
 |
Quadrant C |
| Plot type | Count rate plots | Images |
|---|---|---|
| Comparison with Poisson distribution Blue bars denote a histogram of data divided into 1 sec bins. Red curve is a Poisson curve with rate = median count rate of data. |
 |
 |
| Quadrant-wise count rates Data is divided into 100 sec bins |
 |
|
| Module-wise count rates for Quadrant A Data is divided into 100 sec bins |
 |
 |
| Module-wise count rates for Quadrant B Data is divided into 100 sec bins |
 |
 |
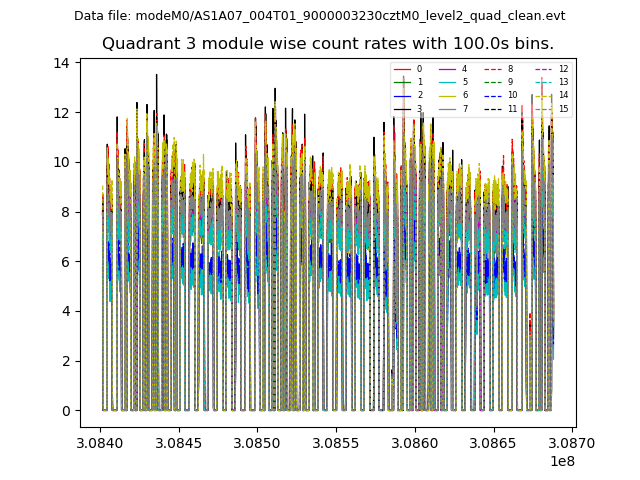
| Module-wise count rates for Quadrant C Data is divided into 100 sec bins |
 |
 |
| Module-wise count rates for Quadrant D Data is divided into 100 sec bins |
 |
 |
| Parameter | Plot |
|---|---|
| CZT HV Monitor |  |
| D_VDD |  |
| Temperature 1 |  |
| Veto HV Monitor |  |
| Veto LLD |  |
| Alpha Counter |  |
| _CPM_Rate |  |
| CZT Counter |  |
| +2.5 Volts monitor |  |
| +5 Volts monitor |  |
| _ROLL_ROT |  |
| _Roll_DEC |  |
| _Roll_RA |  |
| Veto Counter |  |